
MUSIC VISUALIZATION IN iTunes – PART I
Music is inherently enjoyed by our brains via our ears. To me this enjoyment can be heightened by actually seeing the music being played. The delightful vibration and cascade of frequencies adds to the experience. It appears that I am a sucker for visual things.
This first part of the three-part series on music visualization, by a non-musically inclined author, is devoted to using the iTunes SDK to plot the spectrogram of the music being played. First, I would like to express my gratitude to the nice folks at Apple for providing the general public with such a software development kit. Although the download location of the SDK is not that obvious, you can find it on Apple’s website after a little bit of searching.
The following brief document outlines the salient features of displaying a spectrograph as a visualization within iTunes. It is assumed that the dear reader possesses enough knowledge to compile & link the plugin and can place the resulting file into the appropriate folder. As of writing this document, the plugin bundle has to be moved to your_username/Library/iTunes/iTunes Plug-ins/ folder. Of course, this location may be different with an update to iTunes or OSX. In the Xcode project, the file called iTunesPlugInMac.mm will be modified. The project, as is, provides all the necessary mechanisms for initialization.
The modifications, in order, will be made to the following functions; DrawVisual and drawRect. DrawVisual will take care of plotting the spectrograph and the drawRect function will select what visualization to draw. Parts II and III of this mini-series will have different visualizations, so which to display can be selected in drawRect.
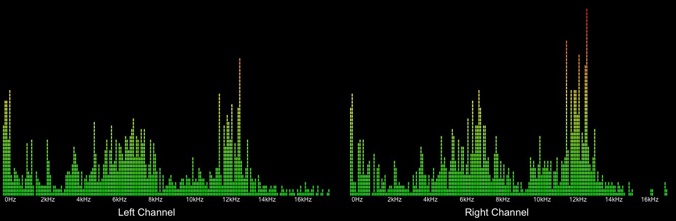
The DrawVisual function enables us to draw onto a canvas in response to the music being played. To keep things minimal, the background will be cleared to black, a nice grey border with rounded corners will be added as well. The spectrograph for both left and right channels will occupy the bottom half of the screen while the upper part will show the album cover, the performer, song and album title. It is kept simple.
The SDK provides the frequencies retrieved from a FFT. The information gathered from the Net lists the FFT as a 512-coefficient for the two channels. The values for each element of the array have entries in the range 0-255. The SDK has access to this information in the visualPluginData->renderData.spectrumData data structure.
Next, I’ll present the DrawVisual function with annotated source code.
void DrawVisual(VisualPluginData *visualPluginData)
{

  // definition of the rectangle to draw into
  CGRect drawRect;
  // a start point of an entity to draw
  CGPointstartPoint;
  // the extent of a bar(graph) for visualization - allowing rescaling the
  // visualization window
  CGPointbarExtent;
  // extent of area to draw into
  CGPoint drawAreaExtent;

  // this shouldn't happen but let's be safe
  if (visualPluginData->destView==NULL) {
    return;
  }

  // obtain the extent of the current widow to draw into
  drawRect=[visualPluginData->destView bounds];
  drawAreaExtent.x=drawRect.size.width;
  drawAreaExtent.y=drawRect.size.height;

  // fill background
  [[NSColor blackColor] set];
  NSRectFill(drawRect);

  // draw gray border
  CGRectborderRect;
  borderRect.origin.x=5.0;
  borderRect.origin.y=5.0;
  borderRect.size.width=drawAreaExtent.x-10.0;
  borderRect.size.height=drawAreaExtent.y-10.0;

  [[NSColor grayColor] setStroke];
  DrawRoundedRect(borderRect,5.0,5.0,3.0);

  // the maximum number of channels one can show
  int numSpectrumChannelsToShow=256;
  // padding (empty space) between the segments of the bar graph, both
  // horizontally and vertically
  float barPaddingX=2.0;
  float barPaddingY=2.0;
  // height of each individual segment
  float barSegmentHeight=5.0;
  // determine the locations of frequency marks
  // human hearing can detect sound in the 20Hz to 20kHz range
  // so I decided that we will show ten equally spaced values as labels
  // within this range
  int frequencyMarks[10]={0,2000,4000,6000,8000,10000,12000,
                                           14000,16000,18000};
  NSArray *labelArray=[[NSArray alloc]
      initWithObjects:@"0Hz",@"2kHz",@"4kHz",@"6kHz",
                      @"8kHz",@"10kHz",@"12kHz",@"14kHz",
                      @"16kHz",@"18kHz",nil];
  int frequencyMarksLocations[10];
  int counter=0;

  // retrieve the sampling frequency of the music being played
  // and establish what is the actual spacing (in Hz) between the values
  float oneIndexSpacing=visualPluginData->trackInfo.sampleRateFloat/512.0;

  // store the location (index) where each of the label’s frequencies are found
  for (int i=0;i<numSpectrumChannelsToShow;++i) {
    if ((int)(i*oneIndexSpacing)>frequencyMarks[counter] && counter<10) {
      frequencyMarksLocations[counter]=i;
      ++counter;
    }
  }

  // create a font and set up the attributes for the labels
  NSFont *labelFont=[NSFont fontWithName:@"Arial" size:12.0];
  NSDictionary *labelAttrs=[NSDictionary dictionaryWithObjectsAndKeys:
                           [NSColor whiteColor],
                           NSForegroundColorAttributeName, labelFont,
                           NSFontAttributeName, NULL];

  // display the left channel labels
  counter=0;
  for (int i=0;i<frequencyMarksLocations[9];++i) {
    startPoint.x=20.0;
    startPoint.y=45.0;

    barExtent.x=(drawAreaExtent.x*0.5-startPoint.x*2.0
                     -barPaddingX*frequencyMarksLocations[9])/
                     frequencyMarksLocations[9];

     if (barExtent.x<1.0) {
       barExtent.x=1.0;
       barPaddingX=0.0;
     }

     startPoint.x+=i*(barExtent.x+barPaddingX);
     startPoint.y=startPoint.y;

     if (i==frequencyMarksLocations[counter] && counter<10) {
       NSString *frequencyLabel=NULL;
       frequencyLabel=[labelArray objectAtIndex:counter];

       if (frequencyLabel!=NULL) {
         [frequencyLabel drawAtPoint:startPoint withAttributes:labelAttrs];
       }

       ++counter;
     }
   }

   // pick another font and set up the attributes for the channel labels
   NSFont *channelLabelFont=[NSFont fontWithName:@"Arial" size:20.0];
   NSDictionary *channelLabelAttrs=[NSDictionary dictionaryWithObjectsAndKeys:
                 [NSColor whiteColor], NSForegroundColorAttributeName,
                 channelLabelFont, NSFontAttributeName, NULL];

   startPoint.x=drawAreaExtent.x*0.18;
   startPoint.y=15.0;

   // display the label
   NSString *leftChannelLabel=@"Left Channel";
   [leftChannelLabel drawAtPoint:startPoint withAttributes:channelLabelAttrs];

   // left channel bar graphs
   for (int i=0;i<frequencyMarksLocations[9];++i) {
     startPoint.x=20.0;
     startPoint.y=60.0;

     barExtent.x=(drawAreaExtent.x*0.5-startPoint.x*2.0
                     -barPaddingX*frequencyMarksLocations[9])/
                     frequencyMarksLocations[9];

    if (barExtent.x<1.0) {
      barExtent.x=1.0; barPaddingX=0.0;
    }
    startPoint.x+=i*(barExtent.x+barPaddingX);
    startPoint.y=startPoint.y;
    float factor=(visualPluginData->renderData.spectrumData[0][i]/256.0);

    float available_space=drawAreaExtent.y*0.5-startPoint.y-20.0;
    barExtent.y=factor*available_space;

    // determine the number of segments (vertically) to display for this entry
    int numSegments=(int)(factor*available_space)/(barPaddingY
                                                +barSegmentHeight);
    // determine the maximum number of segments one can display
    int numMaxSegments=(int)(available_space)/(barPaddingY
                                                +barSegmentHeight);

    // draw each segment
    for (int j=0;j<numSegments;++j) {

      CGFloatred;
      CGFloatgreen;
      CGFloatblue;

      float inputValue=((float)j/(float)numMaxSegments)*255.0;

      // compute the color corresponding to this value
      GetColorGreenYellowRed(inputValue,0.0,255.0,&red,&green,&blue);

      [[NSColor colorWithDeviceRed:red green:green blue:blue alpha:1]
                             set];

      float segmentStartY=startPoint.y+j*(barPaddingY+barSegmentHeight);

      drawRect=NSMakeRect(startPoint.x,segmentStartY,barExtent.x,
                                                          barSegmentHeight);

      // draw the segment
      DrawRectFilled(drawRect);
    }
  }

  // display the right channel labels
  counter=0;
  for (int i=0;i<frequencyMarksLocations[9];++i) {
    startPoint.x=20.0;
    startPoint.y=45.0;

    barExtent.x=(drawAreaExtent.x*0.5-startPoint.x*2.0
                     -barPaddingX*frequencyMarksLocations[9])/
                     frequencyMarksLocations[9];

    if (barExtent.x<1.0) {
      barExtent.x=1.0;
      barPaddingX=0.0;
    }

    startPoint.x+=i*(barExtent.x+barPaddingX);
    startPoint.y=startPoint.y;

    CGPoint startPointR;

    startPointR.x=startPoint.x+drawAreaExtent.x*0.5;
    startPointR.y=startPoint.y;

    if (i==frequencyMarksLocations[counter] && counter<10) {
      NSString *frequencyLabel=NULL;
      frequencyLabel=[labelArray objectAtIndex:counter];

      if (frequencyLabel!=NULL) {
        [frequencyLabel drawAtPoint:startPointR withAttributes:labelAttrs];
      }

      ++counter;
    }
  }

  startPoint.x=drawAreaExtent.x*0.68;
  startPoint.y=15.0;

  // display the right channel label
  NSString *rightChannelLabel=@"Right Channel";
  [rightChannelLabel drawAtPoint:startPoint withAttributes:channelLabelAttrs];

  // right channel bar graphs
  for (int i=0;i<frequencyMarksLocations[9];++i) {
    startPoint.x=20.0;
    startPoint.y=60.0;

    barExtent.x=(drawAreaExtent.x*0.5-startPoint.x*2.0
                     -barPaddingX*frequencyMarksLocations[9])/
                     frequencyMarksLocations[9];

    if (barExtent.x<1.0) {
      barExtent.x=1.0; barPaddingX=0.0;
    }
    startPoint.x+=i*(barExtent.x+barPaddingX);
    startPoint.y=startPoint.y;
    float factor=(visualPluginData->renderData.spectrumData[1][i]/256.0);
    float available_space=drawAreaExtent.y*0.5-startPoint.y-20.0;
    barExtent.y=factor*available_space;

    // determine the number of segments (vertically) to display for this entry
    int numSegments=(int)(factor*available_space)/(barPaddingY
                                        +barSegmentHeight);
    // determine the maximum number of segments one can display
    int numMaxSegments=(int)(available_space)/(barPaddingY
                                        +barSegmentHeight);

    // draw each segment
    for (int j=0;j<numSegments;++j) {
      CGFloatred;
      CGFloatgreen;
      CGFloatblue;

      float inputValue=((float)j/(float)numMaxSegments)*255.0;                          // compute the color corresponding to this value
      GetColorGreenYellowRed(inputValue,0.0,255.0,&red,&green,&blue);
      [[NSColor colorWithDeviceRed:red green:green blue:blue alpha:1]                            set];
      float segmentStartY=startPoint.y+j*(barPaddingY+barSegmentHeight);
      drawRect=NSMakeRect(startPoint.x+drawAreaExtent.x*0.5,                                 segmentStartY,barExtent.x,barSegmentHeight);
      // draw the segment DrawRectFilled(drawRect);
    }
  }

  // display song title, performer etc.
  startPoint=CGPointMake(30.0,drawAreaExtent.y*0.5+20.0);
  NSFont *stringFont=[NSFont fontWithName:@"Arial" size:14.0];
  NSDictionary *attrs=[NSDictionary dictionaryWithObjectsAndKeys:                            [NSColor whiteColor],NSForegroundColorAttributeName, stringFont,
                            NSFontAttributeName, NULL];
  NSString *theTrackNumber=NULL;

  if (visualPluginData->trackInfo.trackNumber!=0) {
    theTrackNumber=[NSString stringWithFormat:@"%i",
                           visualPluginData->trackInfo.trackNumber];
  }
  if (theTrackNumber!=NULL) {
    [theTrackNumber drawAtPoint:startPoint withAttributes:attrs];
  }

  startPoint.x+=20.0;

  NSString *theNumTracks=NULL;

  if (visualPluginData->trackInfo.numTracks!=0) {
    theNumTracks=[NSString stringWithFormat:@"/%i",
            visualPluginData->trackInfo.numTracks];
  }
  else {
    theNumTracks=[NSString stringWithFormat:@"/?"];
  }

  if (theNumTracks!=NULL) {
    [theNumTracks drawAtPoint:startPoint withAttributes:attrs];
  }

  startPoint.x+=30.0;

  NSString *theArtist=NULL;

  if (visualPluginData->trackInfo.artist[0]!=0) {
    theArtist=[NSString stringWithCharacters:
                    &visualPluginData->trackInfo.artist[1]
                    length:visualPluginData->trackInfo.artist[0]];
  }

  if (theArtist!=NULL) {
    [theArtist drawAtPoint:startPoint withAttributes:attrs];
  }

  startPoint.x+=[theArtist length]*8.0+8.0;

  NSString *theAlbum=NULL;

  if (visualPluginData->trackInfo.album[0]!=0) {
    theAlbum=[NSString stringWithCharacters:
           &visualPluginData->trackInfo.album[1]
           length:visualPluginData->trackInfo.album[0]];
  }

  if (theAlbum!=NULL) {
    [theAlbum drawAtPoint:startPoint withAttributes:attrs];
  }

  startPoint.x+=[theAlbum length]*8.0+8.0;

  // if we have a song title, draw it (prefer the stream title
  // over the regular name if we have it)
  NSString *theSongTitle=NULL;

  if (visualPluginData->streamInfo.streamTitle[0]!=0) {
    theSongTitle=[NSString stringWithCharacters:
            &visualPluginData->streamInfo.streamTitle[1]
            length:visualPluginData->streamInfo.streamTitle[0]];
  }
  else if ( visualPluginData->trackInfo.name[0]!=0) {
    theSongTitle=[NSString stringWithCharacters:
            &visualPluginData->trackInfo.name[1]
            length:visualPluginData->trackInfo.name[0]];
  }

  if (theSongTitle!=NULL) {
    [theSongTitle drawAtPoint:startPoint withAttributes:attrs];
  }

  startPoint.x+=[theSongTitle length]*8.0+8.0;

  NSString *theYear=NULL;

  if (visualPluginData->trackInfo.year!=0) {
    theYear=[NSString stringWithFormat:@"(%i)",
              visualPluginData->trackInfo.year];
  }
  else {
    theYear=[NSString stringWithFormat:@"(?)"];
  }

  if (theYear!=NULL) {
    [theYear drawAtPoint:startPoint withAttributes:attrs];
  }

  startPoint.x=30.0;

  // draw the artwork
  if (visualPluginData->currentArtwork!=NULL) {
    startPoint.y+=20.0;
    NSSize aSize;
    aSize.width=(drawAreaExtent.y*0.5-60.0);
    aSize.height=(drawAreaExtent.y*0.5-60.0);

    [visualPluginData->currentArtwork setSize:aSize];
    [visualPluginData->currentArtwork drawAtPoint:startPoint
                                             fromRect:NSZeroRect
                                            operation:NSCompositeSourceOver
                                             fraction:1.0];
  }
}
Other miscellaneous functions utilized in the above function:
// interpolate the color cube (in the R, G and B space) to obtain the color
// the lowest value (0) is green and the highest (1) is red
void GetColorGreenYellowRed(CGFloat d, CGFloat dmin, CGFloat dmax, CGFloat *r, CGFloat *g, CGFloat *b)
{
  CGFloat ds;

  if (d<dmin) {
    d=dmin;
  }
  if (d>dmax) {
    d=dmax;
  }

  ds=dmax-dmin;

  if (d<(dmin+0.5*ds)) {
    *r=0.0+(d-dmin)/(ds*0.5);
    *g=1.0;
    *b=0.0;
  }
  if (d>=(dmin+0.5*ds)) {
    *r=1.0;
    *g=1.0-(d-ds*0.5)/(ds*0.5);
    *b=0.0;
  }
}

// draw a rounded rectangle
void DrawRoundedRect(NSRect rect, CGFloat x, CGFloat y, CGFloat lineWidth)
{
    NSBezierPath* thePath=[NSBezierPath bezierPath];

    [thePath setLineWidth:lineWidth];
    [thePath appendBezierPathWithRoundedRect:rect xRadius:x yRadius:y];
    [thePath stroke];
}

// draw a filled rectangle
void DrawRectFilled(NSRect rect)
{
  NSRectFill(rect);
  [NSBezierPath strokeRect:rect];
}
Note that these functions are driven by the following, already implemented function:
-(void)drawRect:(NSRect)dirtyRect
{
  if ( _visualPluginData != NULL ) {
    DrawVisual(_visualPluginData);
  }
}
And that is about it! I hope this short tutorial, if I can call it that, would enable you to create some awesome visualizations! In the next part we will look at another way to display the same frequency information.
Note: Apple, iTunes and other hardware/software is trademark of their respective owners.