

Get the code NOW at GitHub!
In my line of work quite often the need arises to plot something. Results of numerical simulation are often easier interpreted as graphs, plots or other renderings of the underlying numbers. Take for example the computational fluid dynamics simulator that I am currently working on. To assess its performance and accuracy, plots of quantities such as velocity are needed to compare them to literature-published benchmarks. The above plot shows a distribution of the horizontal component of velocity along a line midway from the bottom to the top of a lid-driven cavity problem. The benchmark results are plotted as red triangles while the current output of the program is shown as a black line connecting the black circular markers. Pretty standard and simple plot, right?
In the past, the procedure for visualizing simple 2D plots was as follows; create a text output from the program as a two-column x and y delimited file. Then take that into a spreadsheet and generate a chart. It takes about 4-5 minutes to go through the process and enjoy viewing the plot. What if this process could be done automagically from a running program without the hassle to a trip to a spreadsheet? Of course, it can be done. The web is filled with excellent plotting packages, quite a few of them open source or freeware. Gnuplot, Grace or JFreeChart to name a few. Then why does the world need another plotting option? For one, some of them are stand-alone, cannot be integrated into a program, or they are just too bulky and complex requiring a bunch of other libraries to build for just a quick and dirty plot.
Thus, CPlot2D was born out of necessity to be able to incorporate just a few files into any C++ project and plot any quantity. Why CPlot2D as the name? Probably my lack of imagination; it is a class that plots data in two dimensions. Hence CPlot2D. Let me define what CPlot2D is not; it is not a feature-rich plotting library (yet!) that handles all sorts of data and automatically generates a candy-striped output of shapes. It was conceived to create plots for my research that are vector graphics, scalable and simple, for inclusion in publications, journal articles and such. The key is to be able to represent values without too much clutter and effects. Although it can plot multiple data sets in the same plot, it is aimed at concisely representing data. PostScript was chosen as a simple way of generating vector graphics. It can then be translated into any other graphics format as the need arises. Beyond PostScript, in the future, I might be tempted to expand the class to include OpenGL rendering of the data, so both on-screen real-time plotting and PostScript output can be created from the same data.
The motivation to make it available for download and use by anybody stems from the fact that over the years I have enjoyed and learned from many open source projects, thus this is my simple way of giving back to the community. I hope that somebody out there can use my code and he or she will be inspired to contribute as well. I have only one request; if you find it useful in your code, please leave the acknowledgements and copyright in place indicating the origin of this code. If you find one of the potentially numerous bugs in the code, please let me know!
The code is available at GitHub in one of my repositories here.
The code was written such that all relevant parameters can be set or retrieved using the accessor functions. Now, it makes a lot of sense to be able to set things, but why to get them back? At first, I thought that I can just omit all the GetXXX functions, but already I needed access to some plot parameters in another part of a code. So I have implemented most of them. Some quantities are computed just prior to plotting and output, and those are without any accessors.
Also, note that parameters like setting the overall size of the plot or the size of the plot area and the frame around it can be abused to result in an ‘unpredictable’ plot. What I mean is that there is no check to validate every and all possibility of plot sizes, frame widths and placements. Exercise common sense and judgement! You have been warned!
The general organization of the plotting method is as follows. A new instance of the CPlot2D class is created along with a new CDataSet (let’s call it dataSet) and a CDataPoint class. On the most basic level, the CPlot2D class is set up to generate a relatively pleasing output without any change to its default parameters. To be able to plot, the dataSet instance has to be filled with the x and y pairs of data stored in a dataPoint and appended to the dataSet. At this point any change to the dataSet’s representation can be made. See the example driver code further down. Once the dataSet is full, it can then be appended to the CPlot2D instance. Then, it is just a matter of invoking the OutputPostScriptPlot( string fileName ) function with the intended file name for output. And that is it.
As a quick way to demonstrate the use of the CPlot2D class and its helpers, let us consider the driver code, supplied with the downloadable source code. The code, as seen below, is just a few functions exercising the plotting class. A first function call to TestTrigFunctions() results in a plot, as seen below, with just a plot of three familiar trigonometric functions. If you look at the source code, a CPlot2D instance is created along with a dataSet and point. The for loops fill the dataSet with the x and y coordinates from the function evaluations. Subsequently, a colour and a title is assigned to each dataSet. Once a dataSet is complete, it is added to the plot. The plot has its x and y axis titles set and then it is just a matter of calling OutputPostScriptPlot(…) with the desired filename as the argument to the function. Note that by default, filled-in circles are used as data markers and a solid line is connecting the data points. The background grid is light grey with dashed lines. It results in a scheme that reminds me of a well-tailored pinstriped grey suit. The axis labels are computed within the class using a simple algorithm in the spirit of P. Heckbert’s article titled “Nice Number for Graph Labels” in Graphics Gems I ( you can find the original source code here, look towards the bottom of the page). Prior to writing the appropriate code to compute a set of axis tick mark positions and labels, I had the naive thought that it is a quite simple procedure. Not really, there are a few scientific papers written on the topic of axis label generation, so I learned something new…

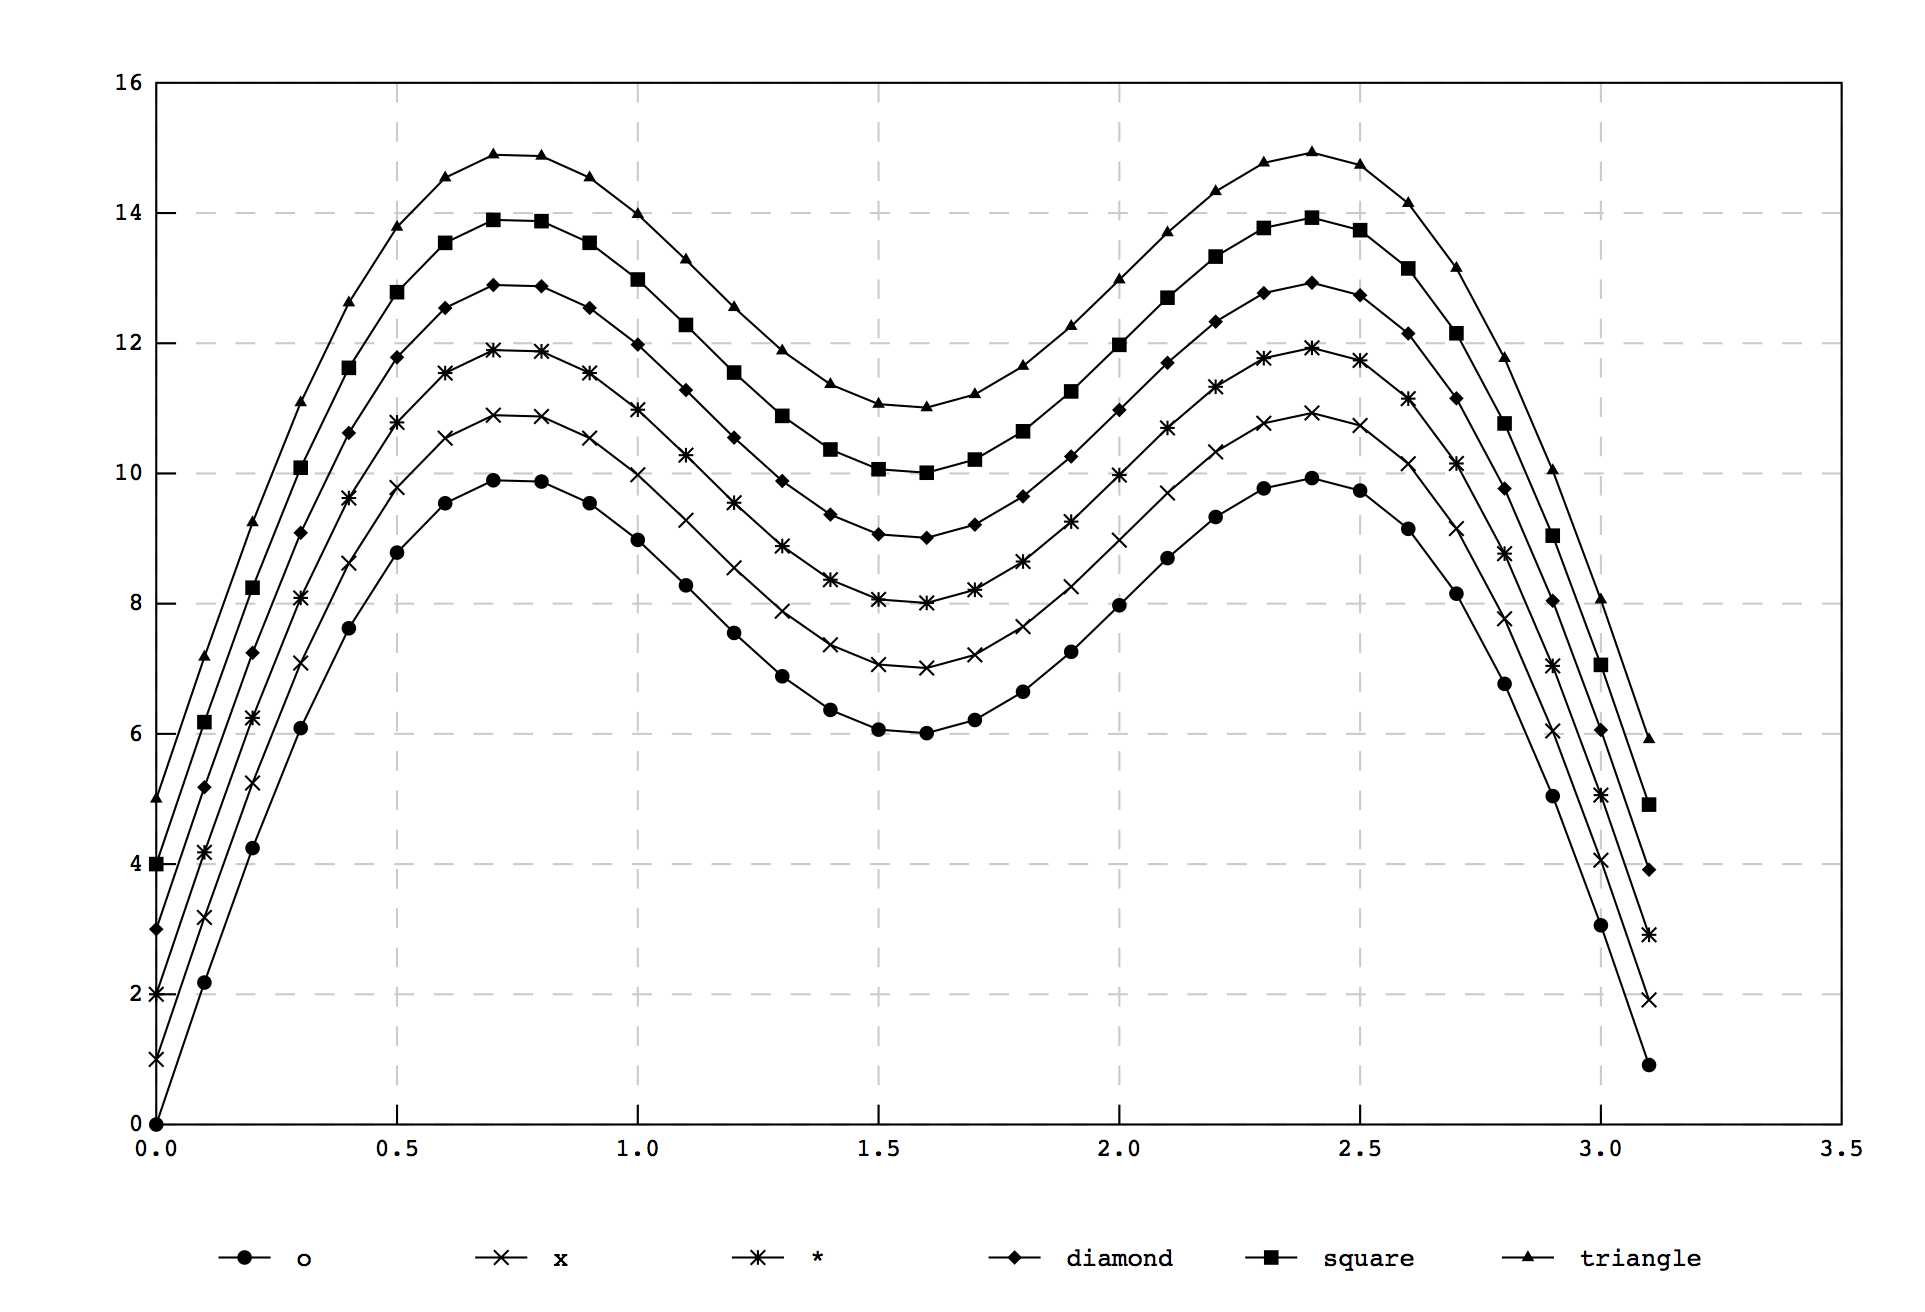
The second exercise for the plotting class demonstrates various marker styles available. Currently, markers can either be a circle, denoted as o (either filled or empty), an X or a *, a diamond (either filled or empty), a square (either filled or empty) or a triangle (either filled or empty). Setting the dataSet marker symbol using SetMarkerSymbol(string) accomplishes this.
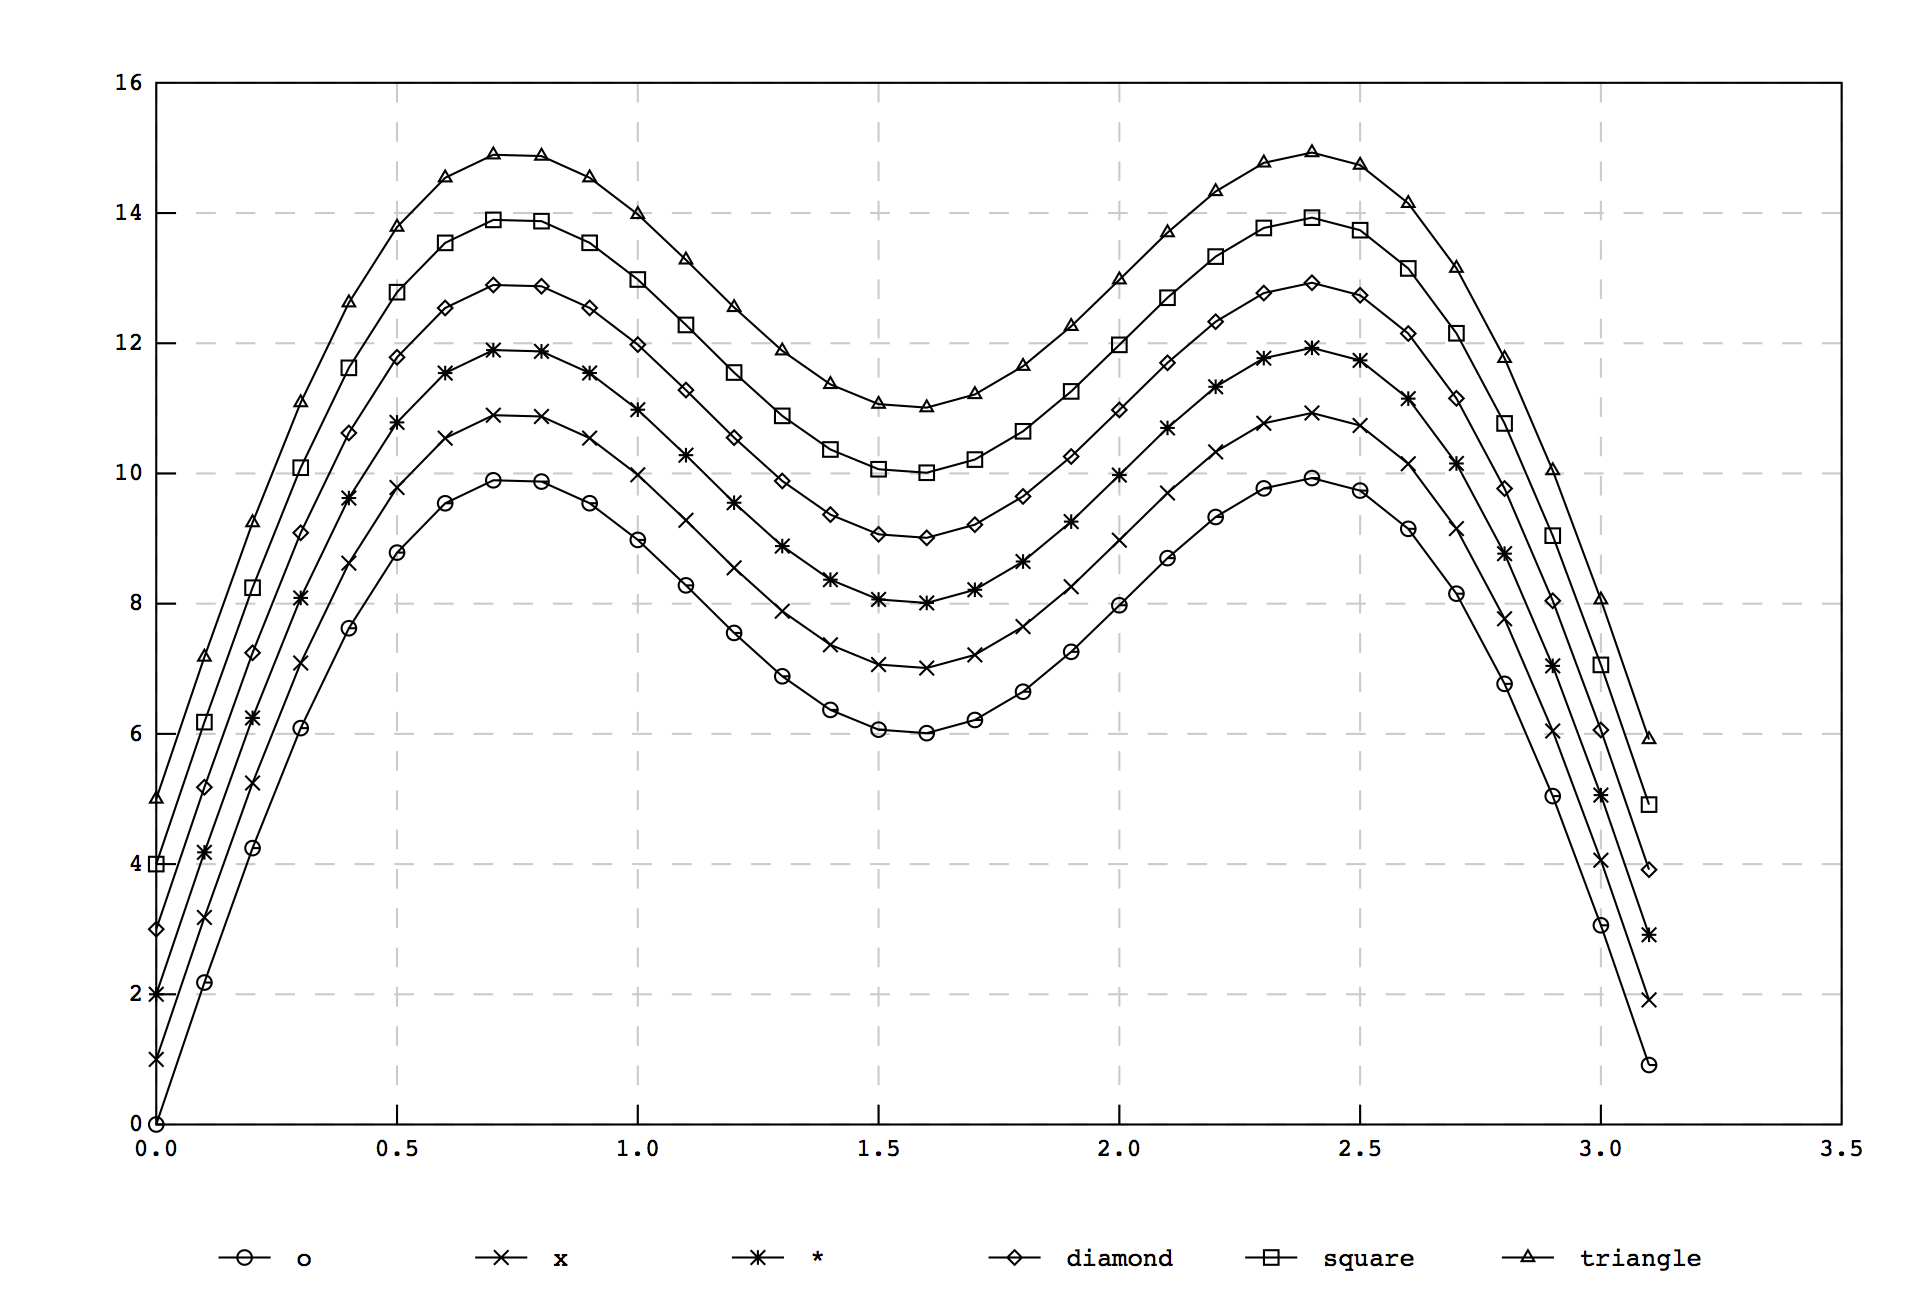
The previous plot had all the markers filled in, while the one below shows the effect of setting SetDrawMarkerFilled(false) for each dataset. Of course, for some symbols, it has no effect, like in the case of a X or *.
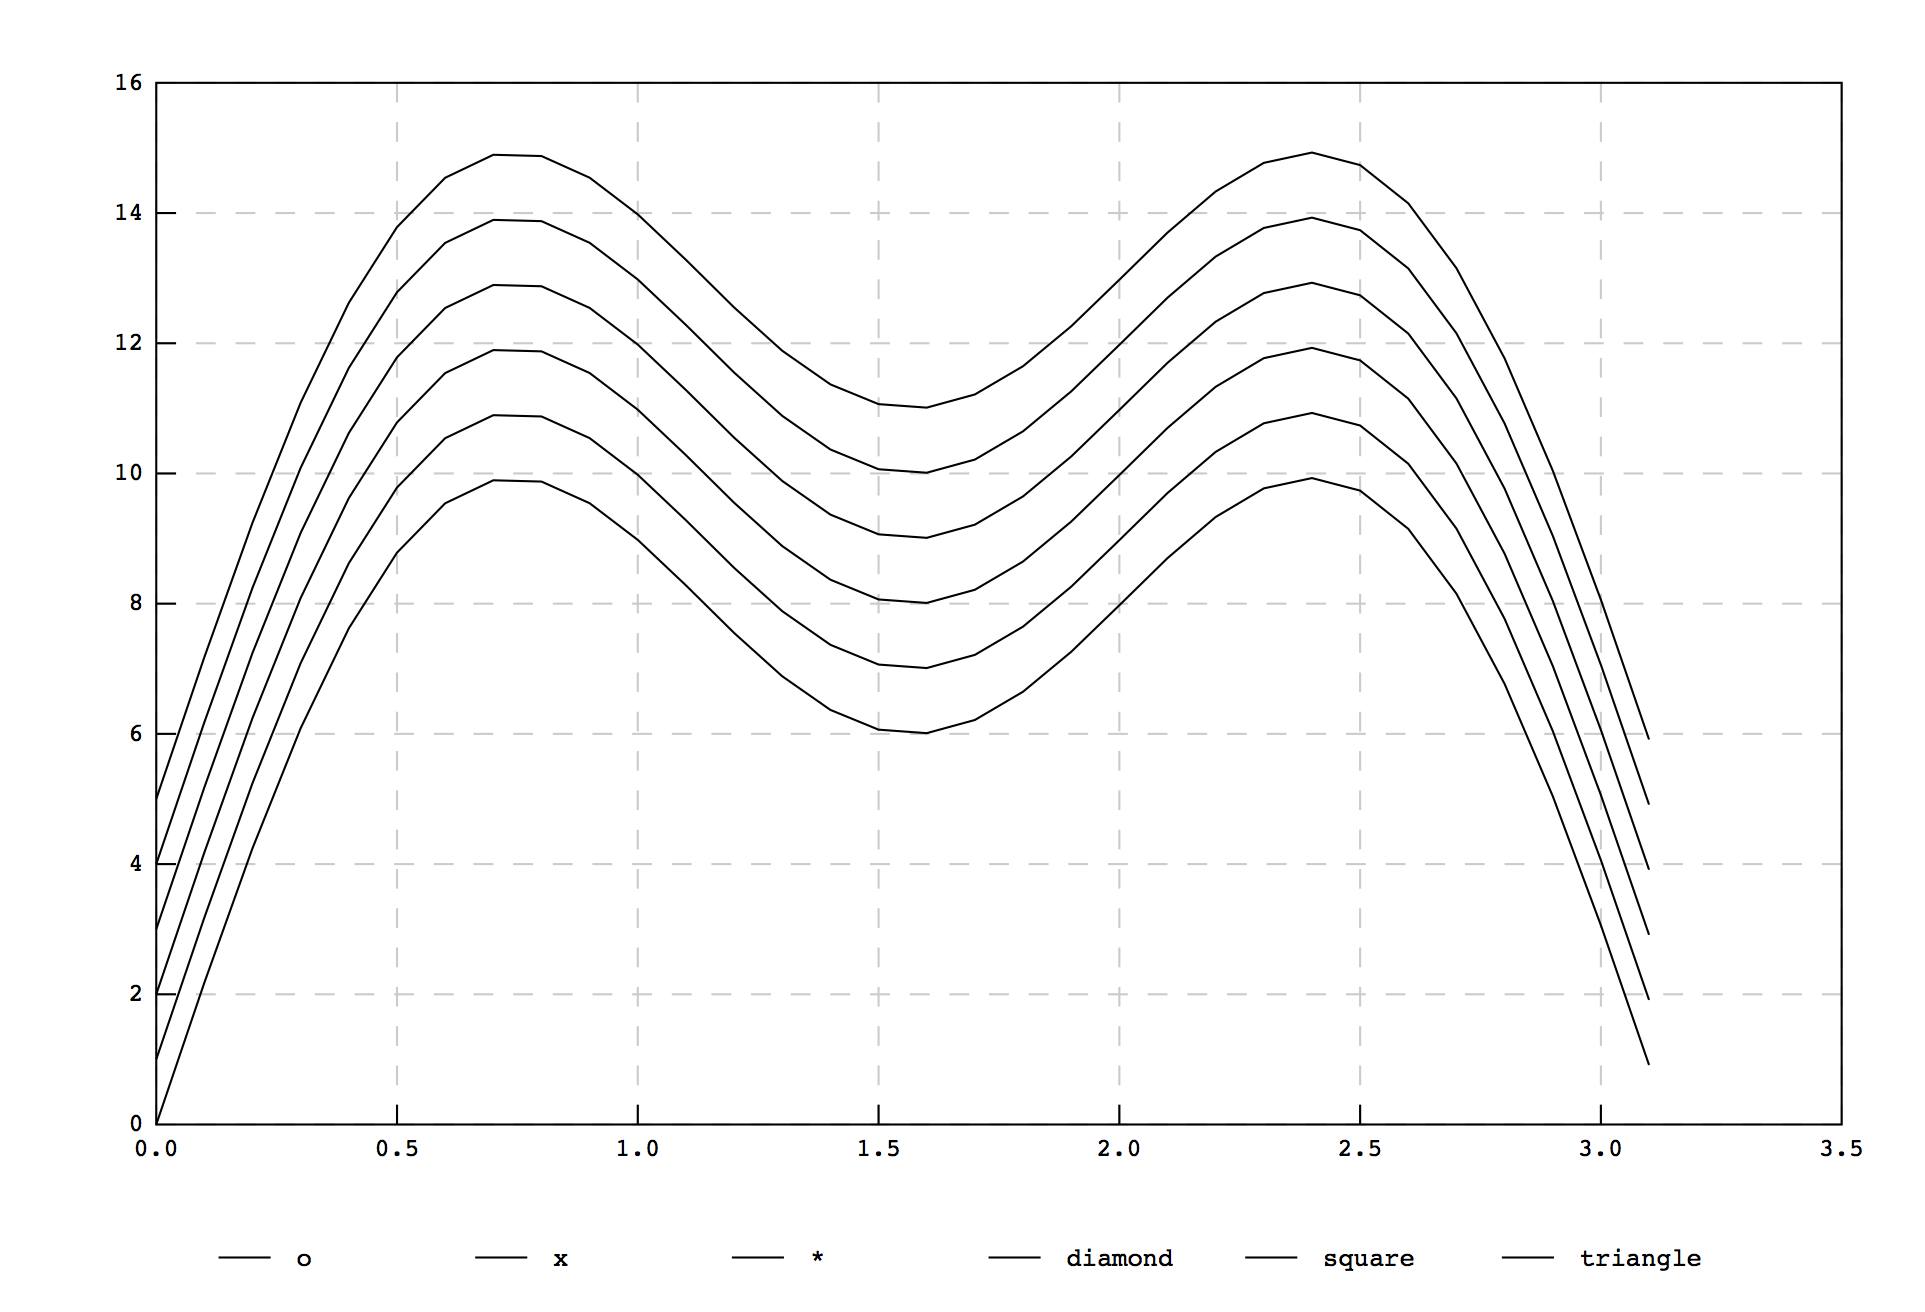
Finally, drawing the markers can be turned off altogether, using SetDrawMarker(false) for each dataSet. The resulting effect is shown below.
Currently, the available grid line plotting is restricted to either no grid lines, solid grid lines or dashed grid lines. The TestLineStyles(…) functions shows these. The colour of grid lines can be set as well, see the full class member function list at the bottom of this article. Grid lines can be turned on or off using a call to the plot’s SetDrawXAxisGridLines(true/false) function. While the line type for a grid line can be set using SetDrawGridLinesDashed(true) for a dashed line style, a false argument results in solid grid lines. The next five plots demonstrate this functionality; a plot with solid grid lines, a plot with dashed grid lines, a plot with no grid lines and finally, two plots with grid lines on one axis only.
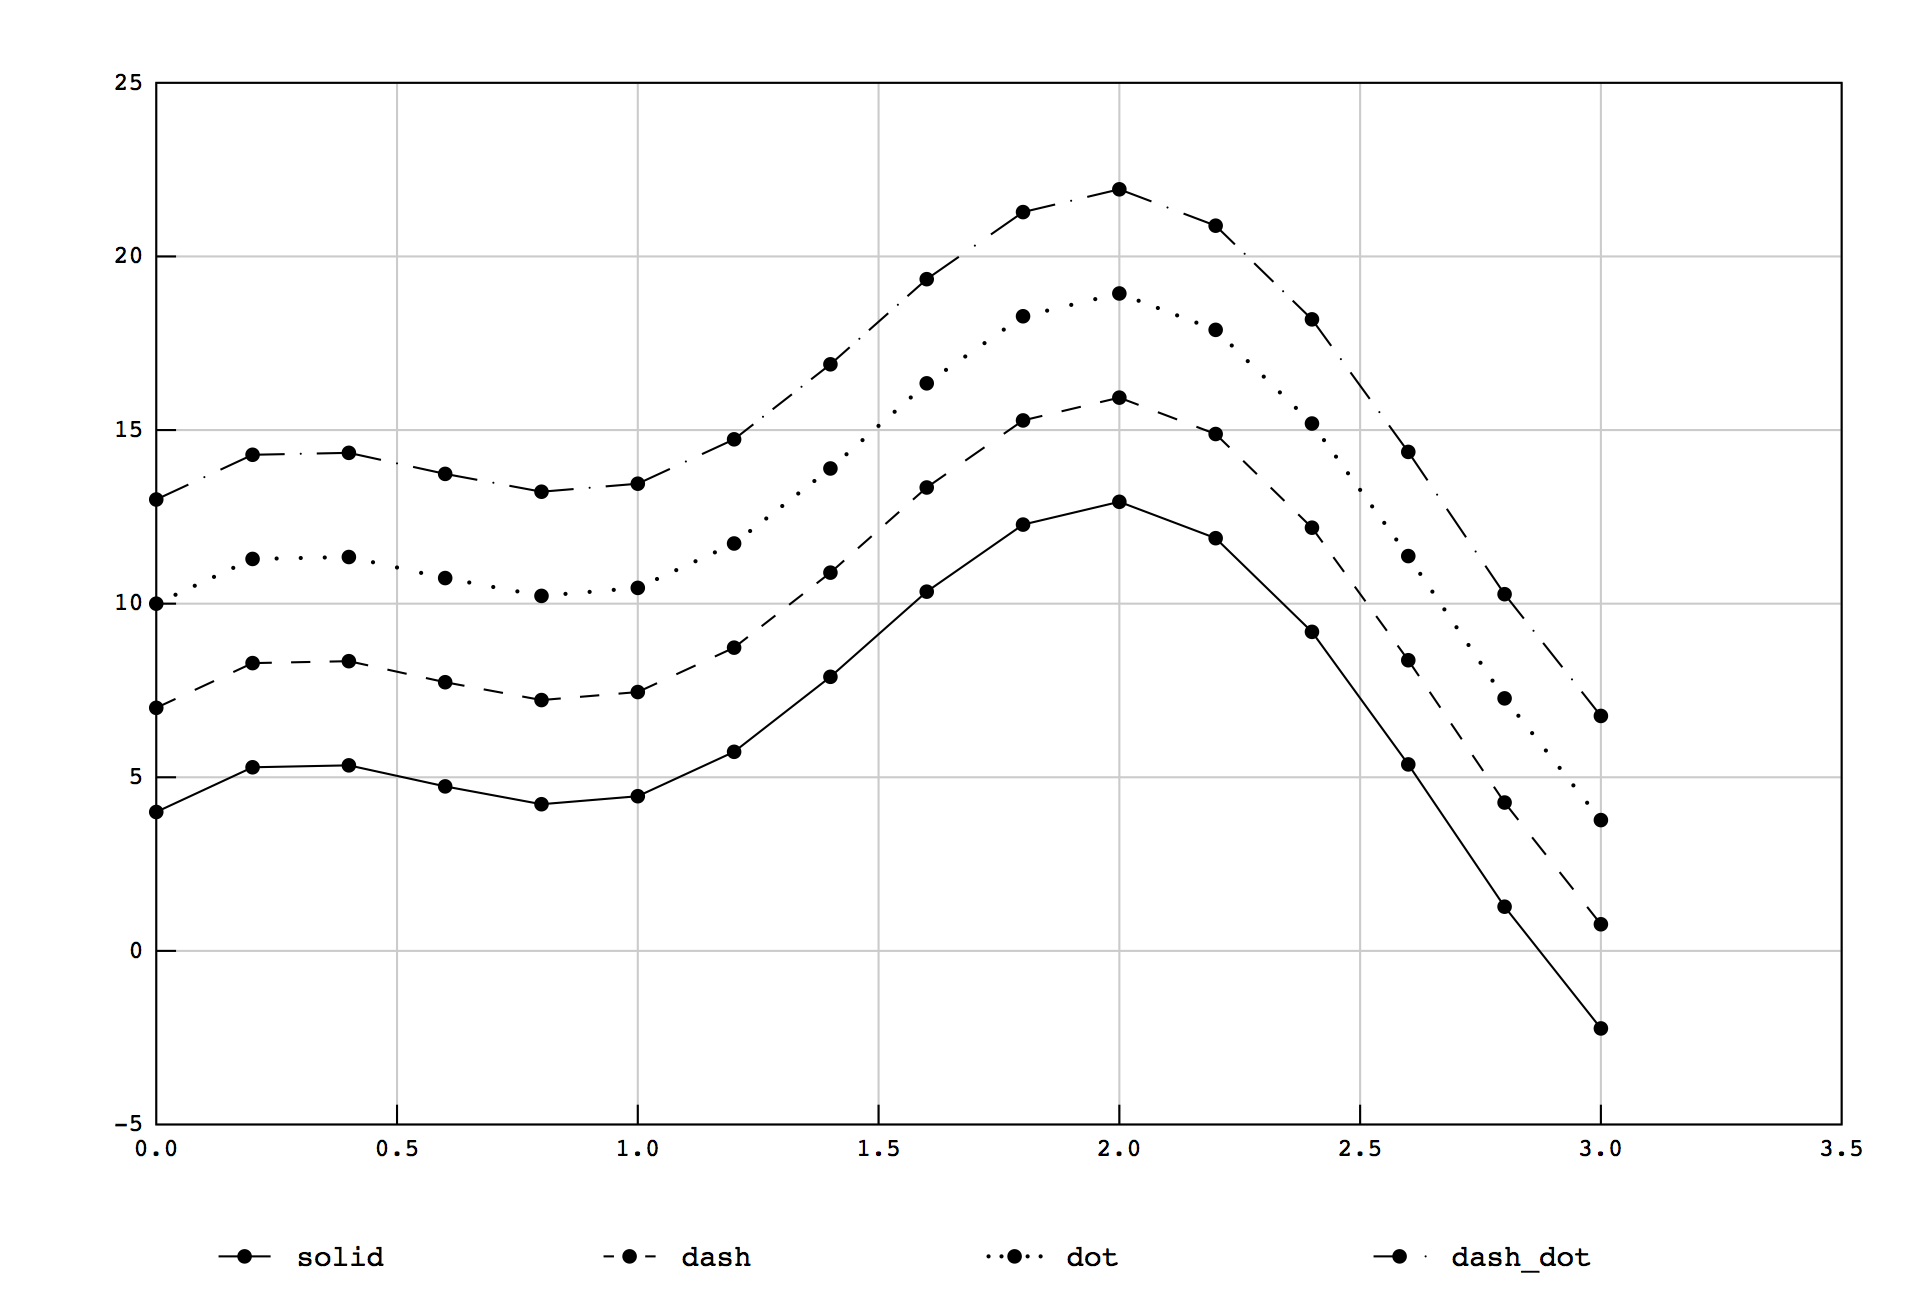
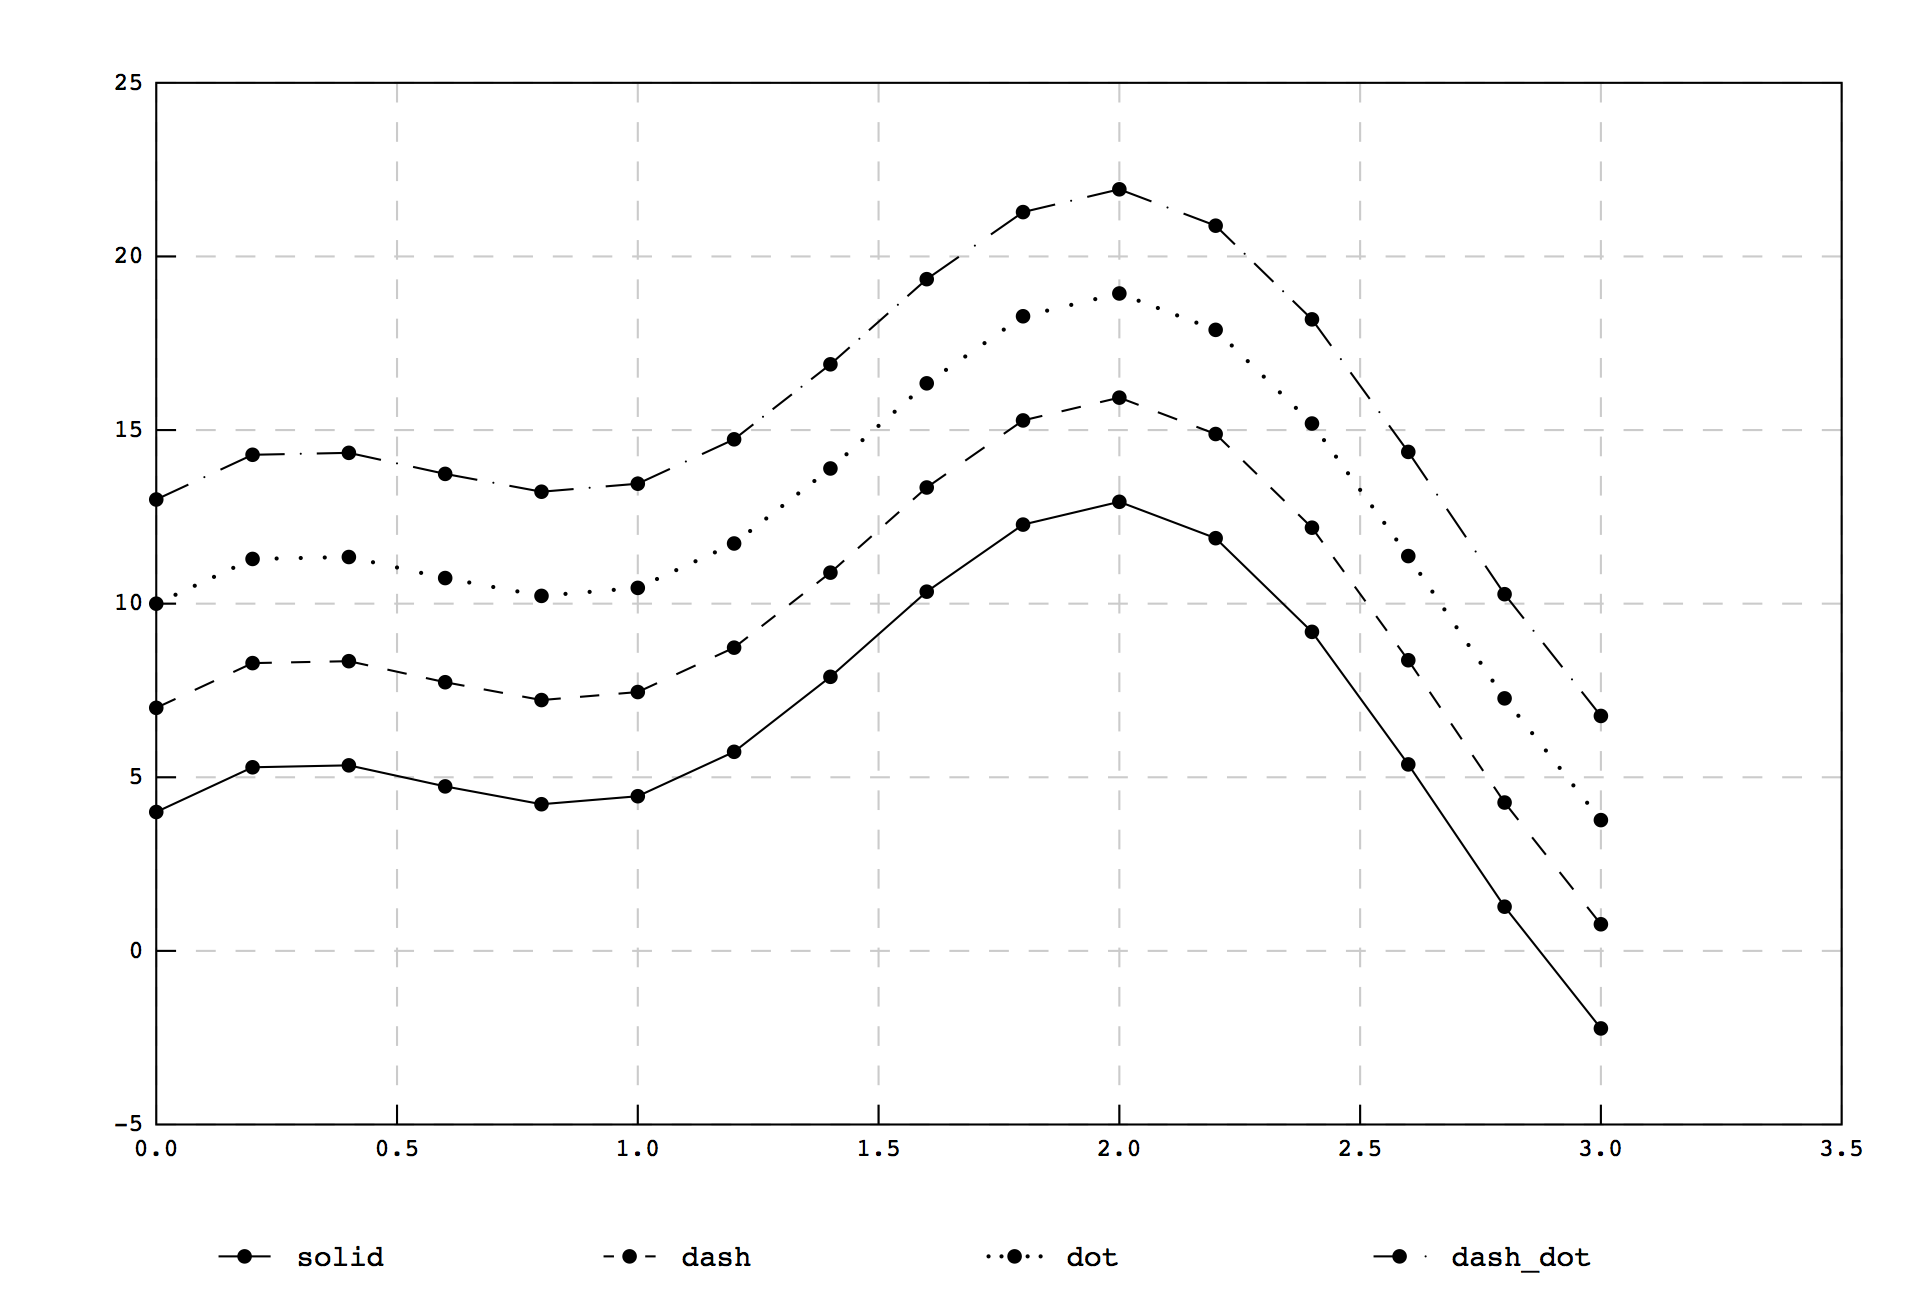
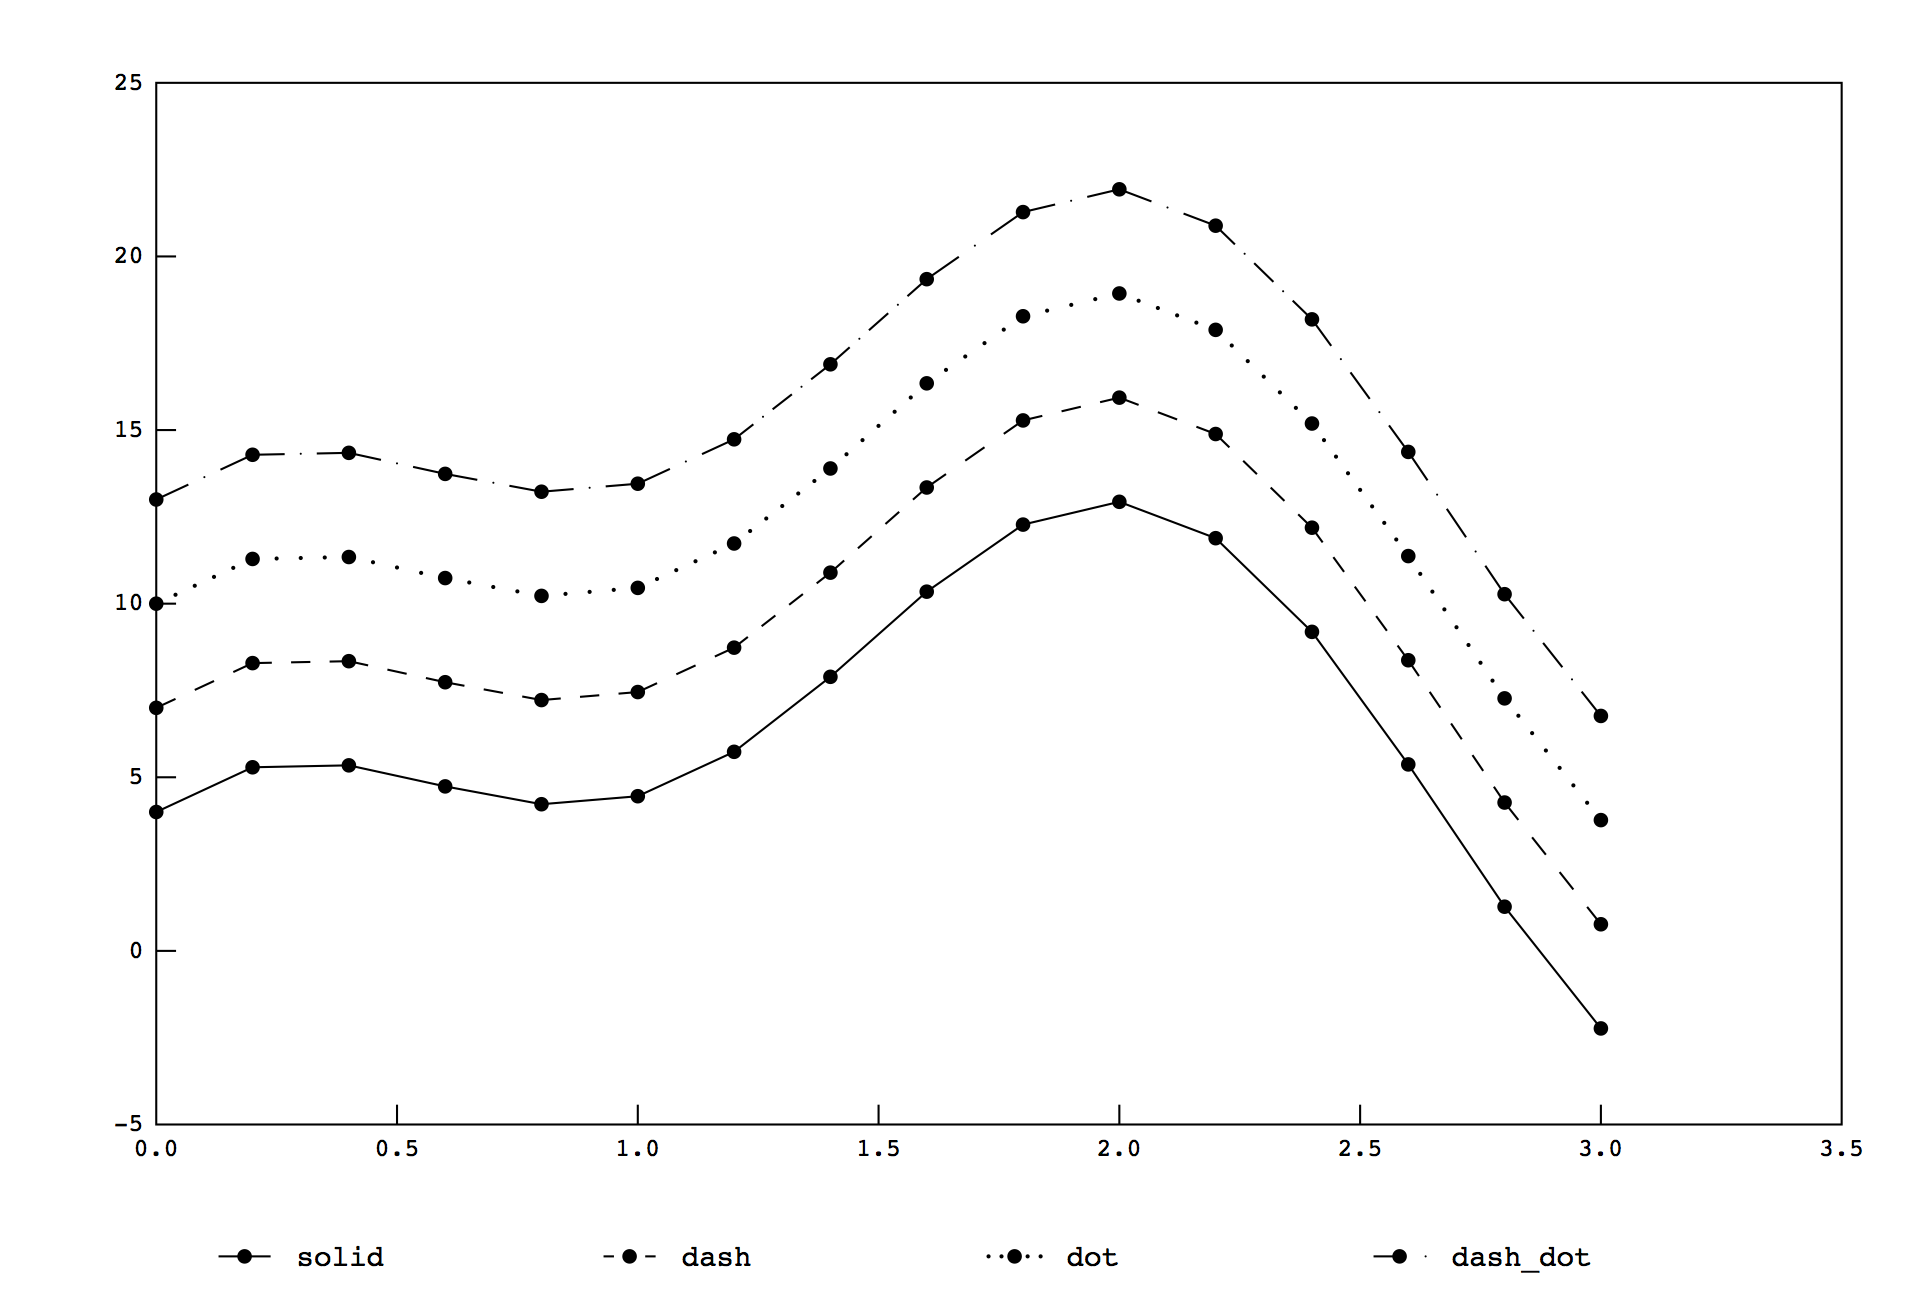


The same TestLineStyles(…) function also illustrates the available line styles connecting data points. Currently, either no lines (see the plot at the start of the article), solid lines, dashed lines, dotted lines and lines with both a dot and a dash are supported. As seen in the source code, a call to SetDashedLine with a true enables dashed lines, while SetDashedLinePattern( string ) can be used to specify the line type as; solid, dash, dot or dash_dot. The various outcomes of these settings can be seen in the plots above.
As a final example, the setting of axis titles and a legend is shown in the figure below.
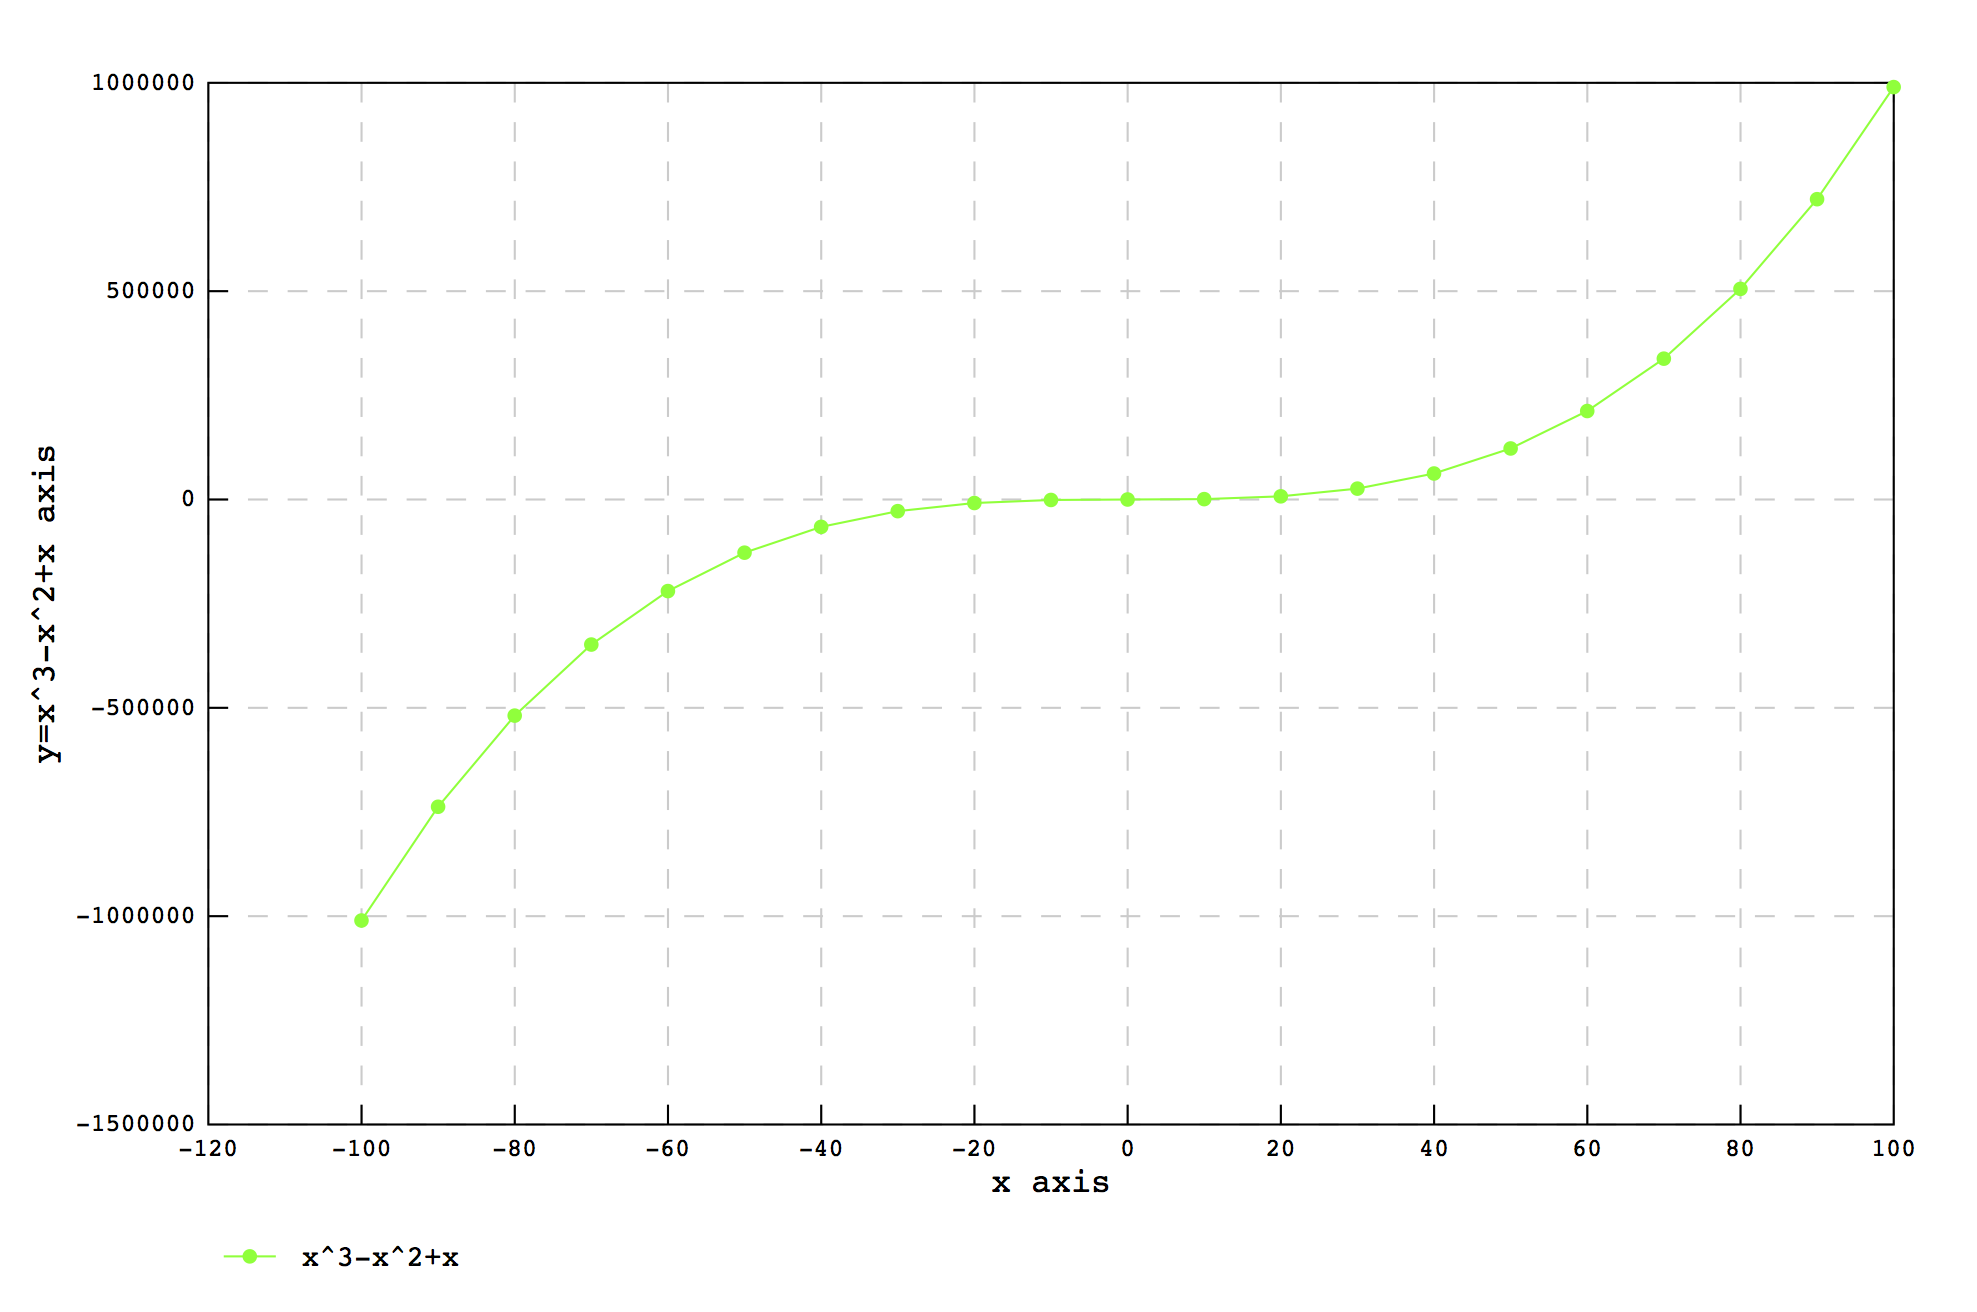
The axis titles can be set using a call to either SetXAxisTitle(…) or SetYAxisTitle(…) with a string as an argument. Note, to accommodate the y axis title, the thickness of the frame around the last plot had to be increased using SetLeftFrameSize(100.0). Just as a reminder, this class is not an automatic silver bullet that can figure out any and every combination of text and legend placement, so at times it has to be nudged in the right direction!
Finally, below is the complete source code for the driver, which exercises the plotting library. The very same is included in the downloadable source code.
[code language="cpp"]
//
//  main.cpp
//  cplot2ddriver
//
//  Created by Attila Michael Zsaki on 14-03-21.
//  Copyright (c) 2014 Attila Michael Zsaki. All rights reserved.
//

#include
#include
#include "CPlot2D.h"

void TestTrigFunctions();
void TestMarkerStyles(bool filledMarker, bool noMarker, string
                      fileName);
void TestLineStyles(int gridStyle, bool xAxisGrid, bool yAxisGrid);
void TestAxisLabels();

int main(int argc, const char * argv[])
{

  TestTrigFunctions();
  TestMarkerStyles(true,false,"test2_marker_styles_a.ps");
  TestMarkerStyles(false,false,"test2_marker_styles_b.ps");
  TestMarkerStyles(true,true,"test2_marker_styles_c.ps");
  TestLineStyles(0,true,true);
  TestLineStyles(1,true,true);
  TestLineStyles(2,true,true);
  TestAxisLabels();

  return 0;
}

void TestTrigFunctions()
{

  CPlot2D *plot2D=new CPlot2D();

  CDataSet dataSet;
  CDataPoint point;

  for (double x=-3.1515;x<=3.2;x+=0.1) {     point.SetValues(x,sin(x));     dataSet.AddDataPoint(point);   }   dataSet.SetDatasetColor(0.0,0.0,0.0);   dataSet.SetDatasetTitle("sin(x)");   plot2D->AddDataSet(dataSet);

  CDataSet dataSet1;

  for (double x=-3.1515;x<=3.2;x+=0.1) {     point.SetValues(x,cos(x));     dataSet1.AddDataPoint(point);   }   dataSet1.SetDatasetColor(1.0,0.0,0.0);   dataSet1.SetDatasetTitle("cos(x)");   plot2D->AddDataSet(dataSet1);

  CDataSet dataSet2;

  for (double x=-3.1515;x<=3.2;x+=0.1) {     point.SetValues(x,sin(x)*cos(x));     dataSet2.AddDataPoint(point);   }   dataSet2.SetDatasetColor(0.0,0.0,1.0);   dataSet2.SetDatasetTitle("sin(x)*cos(x)");   plot2D->AddDataSet(dataSet2);
  plot2D->SetXAxisTitle("variable x");
  plot2D->SetYAxisTitle("function");
  plot2D->OutputPostScriptPlot("test1_trigfunctions.ps");
}

void TestMarkerStyles(bool filledMarker, bool noMarker,
                      string fileName)
{

  CPlot2D *plot2D=new CPlot2D();
  CDataSet dataSet[6];
  CDataPoint point;

  for (int i=0;i<6;++i) {
    for (double x=0.0;x<=3.2;x+=0.1) {       point.SetValues(x,10.0*sin(x)+4.0*sin(3.0*x)+i);       dataSet[i].AddDataPoint(point);     }     if (!filledMarker) {       dataSet[i].SetDrawMarkerFilled(false);     }     if (noMarker) {       dataSet[i].SetDrawMarker(false);     }   }   dataSet[0].SetDatasetColor(0.0,0.0,0.0);   dataSet[0].SetMarkerSymbol("o");   dataSet[0].SetDatasetTitle("o");   plot2D->AddDataSet(dataSet[0]);

  dataSet[1].SetDatasetColor(0.0,0.0,0.0);
  dataSet[1].SetMarkerSymbol("x");
  dataSet[1].SetDatasetTitle("x");
  plot2D->AddDataSet(dataSet[1]);

  dataSet[2].SetDatasetColor(0.0,0.0,0.0);
  dataSet[2].SetMarkerSymbol("*");
  dataSet[2].SetDatasetTitle("*");
  plot2D->AddDataSet(dataSet[2]);

  dataSet[3].SetDatasetColor(0.0,0.0,0.0);
  dataSet[3].SetMarkerSymbol("diamond");
  dataSet[3].SetDatasetTitle("diamond");
  plot2D->AddDataSet(dataSet[3]);

  dataSet[4].SetDatasetColor(0.0,0.0,0.0);
  dataSet[4].SetMarkerSymbol("square");
  dataSet[4].SetDatasetTitle("square");
  plot2D->AddDataSet(dataSet[4]);

  dataSet[5].SetDatasetColor(0.0,0.0,0.0);
  dataSet[5].SetMarkerSymbol("triangle");
  dataSet[5].SetDatasetTitle("triangle");

  plot2D->AddDataSet(dataSet[5]);
  plot2D->OutputPostScriptPlot(fileName);
}

void TestLineStyles(int gridStyle, bool xAxisGrid, bool yAxisGrid)
{

  CPlot2D *plot2D=new CPlot2D();
  CDataSet dataSet[4];
  CDataPoint point;

  for (int i=0;i<4;++i) {
    for (double x=0.0;x<=3.2;x+=0.2) {       point.SetValues(x,10.0*sin(x)+4.0*cos(3.0*x)+3.0*i);       dataSet[i].AddDataPoint(point);     }   }   dataSet[0].SetDatasetColor(0.0,0.0,0.0);   dataSet[0].SetDatasetTitle("solid");   plot2D->AddDataSet(dataSet[0]);
  dataSet[1].SetDatasetColor(0.0,0.0,0.0);
  dataSet[1].SetDashedLine(true);
  dataSet[1].SetDashedLinePattern("dash");
  dataSet[1].SetDatasetTitle("dash");
  plot2D->AddDataSet(dataSet[1]);

  dataSet[2].SetDatasetColor(0.0,0.0,0.0);
  dataSet[2].SetDashedLine(true);
  dataSet[2].SetDashedLinePattern("dot");
  dataSet[2].SetDatasetTitle("dot");
  plot2D->AddDataSet(dataSet[2]);

  dataSet[3].SetDatasetColor(0.0,0.0,0.0);
  dataSet[3].SetDashedLine(true);
  dataSet[3].SetDashedLinePattern("dash_dot");
  dataSet[3].SetDatasetTitle("dash_dot");
  plot2D->AddDataSet(dataSet[3]);

  if (gridStyle==0) {
    plot2D->SetDrawXAxisGridLines(true);
    plot2D->SetDrawYAxisGridLines(true);
    plot2D->SetDrawGridLinesDashed(false);
    plot2D->OutputPostScriptPlot("test4_grid_lines_solid.ps");
    plot2D->SetDrawXAxisGridLines(false);
    plot2D->SetDrawYAxisGridLines(false);
    plot2D->OutputPostScriptPlot("test4_no_grid_lines.ps");
  }

  if (gridStyle==1) {
    plot2D->SetDrawGridLinesDashed(true);
    plot2D->SetDrawXAxisGridLines(true);
    plot2D->SetDrawYAxisGridLines(true);
    plot2D->OutputPostScriptPlot("test4_grid_lines_dashed.ps");
  }

  if (gridStyle==2) {
    plot2D->SetDrawXAxisGridLines(true);
    plot2D->SetDrawYAxisGridLines(false);
    plot2D->OutputPostScriptPlot("test4_no_x_axis_grid_lines.ps");
    plot2D->SetDrawXAxisGridLines(false);
    plot2D->SetDrawYAxisGridLines(true);
    plot2D->OutputPostScriptPlot("test4_no_y_axis_grid_lines.ps");
  }
}

void TestAxisLabels()
{
  CPlot2D *plot2D=new CPlot2D();
  CDataSet dataSet;
  CDataPoint point;

  for (double x=-100.01;x<=100.0;x+=10.0) {     point.SetValues(x,x*x*x-x*x+x);     dataSet.AddDataPoint(point);   }   dataSet.SetDatasetColor(0.0,1.0,0.0);   dataSet.SetDatasetTitle("x^3-x^2+x");   plot2D->AddDataSet(dataSet);
  plot2D->SetXAxisTitle("x axis");
  plot2D->SetYAxisTitle("y=x^3-x^2+x axis");
  plot2D->SetLeftFrameSize(100.0);
  plot2D->OutputPostScriptPlot("test5_axis_labels.ps");

}
[/code]
The CDataPoint, CDataSet and CPlot2D classes are comprised of the following member variables and functions. Doxygen was used to compile this list with an RTF output.
Class Documentation
CDataPoint Class Reference
#include <CPlot2D.h>
Public Member Functions
CDataPoint ()
~CDataPoint ()
CDataPoint (double x, double y)
void SetValues (double x, double y)
void GetValues (double *x, double *y)
double GetX ()
double GetY ()
Protected Attributes
double m_dDataX
double m_dDataY
Detailed Description
A simple container class to hold a data point, comprised of an x and y value stored in a double. Simple accessors are implemented to set and get the data stored.
Constructor & Destructor Documentation
CDataPoint::CDataPoint () [inline]
Constructor for the class. The x and y values are initialized to zero.
CDataPoint::~CDataPoint () [inline]
Nothing really to destruct…
CDataPoint::CDataPoint (double x, double y) [inline]
Constructor for the class with initialization of x and y.
Member Function Documentation
void CDataPoint::GetValues (double * x, double * y) [inline]
Get the x and y values as a pair.
double CDataPoint::GetX () [inline]
Get the x value individually.
double CDataPoint::GetY () [inline]
Get the y value individually.
void CDataPoint::SetValues (double x, double y) [inline]
Another way to set the x and y values.
Member Data Documentation
double CDataPoint::m_dDataX [protected]
Storage for the x value of a data point.
double CDataPoint::m_dDataY [protected]
Storage for the y value of a data point.
CDataSet Class Reference
#include <CPlot2D.h>
Public Member Functions
CDataSet ()
~CDataSet ()
void SetDataPoint (int index, CDataPoint point)
CDataPoint GetDataPoint (int index)
void AddDataPoint (CDataPoint point)
int GetNumberOfDataPointsInSet ()
double GetXMinValue ()
double GetXMaxValue ()
double GetYMinValue ()
double GetYMaxValue ()
double GetXExtent ()
double GetYExtent ()
void SetLineWidth (double lineWidth)
double GetLineWidth ()
void SetDatasetColor (double r, double g, double b)
void GetDatasetColor (double *r, double *g, double *b)
void SetMarkerSymbol (string symbol)
void SetMarkerSize (double size)
void SetDrawLine (bool flag)
void SetDrawMarker (bool flag)
void SetDrawMarkerFilled (bool flag)
string GetMarkerSymbol ()
double GetMarkerSize ()
bool GetDrawLine ()
bool GetDrawMarker ()
bool GetDrawMarkerFilled ()
void SetDashedLinePattern (string pattern)
string GetDashedLinePattern ()
void SetDashedLine (bool dashed)
bool GetDashedLine ()
void SetDatasetTitle (string title)
string GetDatasetTitle ()
void SetDatasetLegendFont (string font)
string GetDatasetLegendFont ()
Protected Attributes
string m_strDatasetTitle
string m_strDatasetLegendFont
double m_dLineWidth
double m_dColor [3]
string m_iDashedLinePattern
string m_strMarker
double m_dMarkerSize
bool m_bDrawLine
bool m_bDrawMarker
bool m_bDrawMarkerFilled
bool m_bDashedLine
vector< CDataPoint > m_dDataPoints
Detailed Description
A container class to hold a dataset. This class stores all the data points in a vector along with attributes specific to representing a dataset, such as the color of the line and markers or the title of the dataset.
Constructor & Destructor Documentation
CDataSet::CDataSet () [inline]
Constructor for the class. The member variables are initialized to common values resulting in a, perhaps, pleasing representation of the data without the need to set anything up.
CDataSet::~CDataSet () [inline]
Nothing really to destruct…
Member Function Documentation
void CDataSet::AddDataPoint (CDataPoint point) [inline]
Add a new data point by appending it to the end of the data vector.
bool CDataSet::GetDashedLine ()[inline]
Gets a boolean representing if the dashed drawing style for the lines spanning data points is active or not.
string CDataSet::GetDashedLinePattern () [inline]
Gets the dased line pattern style used in drawing the line spanning data points.
CDataPoint CDataSet::GetDataPoint (int index) [inline]
Get the data point at the location indicated by the variable index.
void CDataSet::GetDatasetColor (double * r, double * g, double * b) [inline]
Gets the RGB color used for drawing the dataset.
string CDataSet::GetDatasetLegendFont () [inline]
Gets the font used in the plot legend denoting this dataset.
string CDataSet::GetDatasetTitle () [inline]
Gets the string used in the plot legend denoting this dataset.
bool CDataSet::GetDrawLine () [inline]
Returns a boolean representing if the line spanning the data points will be drawn or not.
bool CDataSet::GetDrawMarker () [inline]
Returns a boolean representing if the marker symbol will be drawn or not.
bool CDataSet::GetDrawMarkerFilled () [inline]
Returns a boolean representing if filling the interior of the marker symbol is enabled or disabled.
double CDataSet::GetLineWidth () [inline]
Returns the line width that will be used in drawing the line representing the dataset.
double CDataSet::GetMarkerSize () [inline]
Returns the size of the marker symbol.
string CDataSet::GetMarkerSymbol () [inline]
Returns a string describing the marker symbol.
int CDataSet::GetNumberOfDataPointsInSet () [inline]
Returns the number of data points comprisig the data set.
double CDataSet::GetXExtent () [inline]
Returns the extent (maximum minus minimum) of the x values in the dataset.
double CDataSet::GetXMaxValue () [inline]
Returns the maximum value of the x variable in the dataset by iterating over all data points in the set.
double CDataSet::GetXMinValue () [inline]
Returns the minimum value of the x variable in the dataset by iterating over all data points in the set.
double CDataSet::GetYExtent () [inline]
Returns the extent (maximum minus minimum) of the y values in the dataset.
double CDataSet::GetYMaxValue () [inline]
Returns the maximum value of the y variable in the dataset by iterating over all data points in the set.
double CDataSet::GetYMinValue () [inline]
Returns the minimum value of the y variable in the dataset by iterating over all data points in the set.
void CDataSet::SetDashedLine (bool dashed) [inline]
Sets the drawing style for the lines spanning data points to be dashed.
void CDataSet::SetDashedLinePattern (string pattern) [inline]
Sets the dased line pattern style used in drawing the line spanning data points. For the availabel styles see the declaration of the variable.
void CDataSet::SetDataPoint (int index, CDataPoint point) [inline]
Set a data point at the index location. This function neccessitates the presence of the data location pointed to by the index variable. Generally, the preferred method to set or add data is to use the AddDataPoint() function, which appends the new data point to the dataset.
void CDataSet::SetDatasetColor (double r, double g, double b) [inline]
Sets the RGB color used for drawing the dataset. The range is 0.0-1.0.
void CDataSet::SetDatasetLegendFont (string font) [inline]
Sets the font used in the plot legend denoting this dataset.
void CDataSet::SetDatasetTitle (string title) [inline]
Sets the string used in the plot legend denoting this dataset.
void CDataSet::SetDrawLine (bool flag) [inline]
A flag to enable/disable drawing a line connecting the data points.
void CDataSet::SetDrawMarker (bool flag) [inline]
A flag to enable/disable drawing the marker symbol.
void CDataSet::SetDrawMarkerFilled (bool flag) [inline]
A flag to enable/disable filling the interior of the marker symbol.
void CDataSet::SetLineWidth (double lineWidth) [inline]
Sets the line width that will be used in drawing the line representing the dataset.
void CDataSet::SetMarkerSize (double size) [inline]
Sets the marker symbol size used in drawing the dataset.
void CDataSet::SetMarkerSymbol (string symbol) [inline]
Sets the marker symbol used in drawing the dataset. See the declaration of variable for the available types.
Member Data Documentation
bool CDataSet::m_bDashedLine [protected]
Boolean flag to enable/disable drawing of a dashed line connecting data points.
bool CDataSet::m_bDrawLine [protected]
Boolean flag to enable/disable drawing of the line connecting data points.
bool CDataSet::m_bDrawMarker [protected]
Boolean flag to enable/disable drawing of the marker at the location of data points.
bool CDataSet::m_bDrawMarkerFilled [protected]
Boolean flag to enable/disable infilling of the marker at the location of data points.
double CDataSet::m_dColor[3] [protected]
The color of the line drawn to connect data points.
vector<CDataPoint> CDataSet::m_dDataPoints [protected]
A vector storage for the data points.
double CDataSet::m_dLineWidth [protected]
The width of the line drawn to connect data points.
double CDataSet::m_dMarkerSize [protected]
The size of the marker drawn at each data point.
string CDataSet::m_iDashedLinePattern [protected]
The dashed line pattern drawn to connect data points, the possibilites are (strings): “dot”, “dash” or “dash_dot”.
string CDataSet::m_strDatasetLegendFont [protected]
Size of the font used to show the dataset’s title in the legend.
string CDataSet::m_strDatasetTitle [protected]
Storage for the dataset’s title.
string CDataSet::m_strMarker [protected]
The style for the marker drawn at each data point, possibilities are (strings): “x”, “o”, “*”, “diamond”, “square”, “triangle”.
CPlot2D Class Reference
#include <CPlot2D.h>
Public Member Functions
CPlot2D ()
~CPlot2D ()
void SetXTotalSize (double value)
double GetXTotalSize ()
void SetYTotalSize (double value)
double GetYTotalSize ()
void SetXAxisSize (double value)
double GetXAxisSize ()
void SetYAxisSize (double value)
double GetYAxisSize ()
void SetBottomFrameSize (double value)
double GetBottomFrameSize ()
void SetRightFrameSize (double value)
double GetRightFrameSize ()
void SetTopFrameSize (double value)
double GetTopFrameSize ()
void SetLeftFrameSize (double value)
double GetLeftFrameSize ()
void SetFrameLineWidth (double value)
double GetFrameLineWidth ()
void SetGridLineWidth (double value)
double GetGridLineWidth ()
void SetFrameColor (double r, double g, double b)
void GetFrameColor (double *r, double *g, double *b)
void SetGridColor (double r, double g, double b)
void GetGridColor (double *r, double *g, double *b)
void SetXAxisNumbersSpacing (double spacing)
double GetXAxisNumbersSpacing ()
void SetYAxisNumbersSpacing (double spacing)
double GetYAxisNumbersSpacing ()
void SetDrawXAxisTickMarks (bool flag)
bool GetDrawXAxisTickMarks ()
void SetDrawYAxisTickMarks (bool flag)
bool GetDrawYAxisTickMarks ()
void SetXAxisNumberOfTicks (int number)
int GetXAxisNumberOfTicks ()
void SetYAxisNumberOfTicks (int number)
int GetYAxisNumberOfTicks ()
void SetDrawXAxisGridLines (bool flag)
bool GetDrawXAxisGridLines ()
void SetDrawYAxisGridLines (bool flag)
bool GetDrawYAxisGridLines ()
void SetDrawGridLinesDashed (bool flag)
bool GetDrawGridLinesDashed ()
void SetXAxisLabelFont (string font)
string GetXAxisLabelFont ()
void SetXAxisLabelFontSize (double value)
double GetXAxisLabelFontSize ()
void SetYAxisLabelFont (string font)
string GetYAxisLabelFont ()
void SetYAxisLabelFontSize (double value)
double GetYAxisLabelFontSize ()
void SetXAxisTitleFont (string font)
string GetXAxisTitleFont ()
void SetXAxisTitleFontSize (double value)
double GetXAxisTitleFontSize ()
void SetYAxisTitleFont (string font)
string GetYAxisTitleFont ()
void SetYAxisTitleFontSize (double value)
double GetYAxisTitleFontSize ()
void SetXAxisTitle (string title)
string GetXAxisTitle ()
void SetYAxisTitle (string title)
string GetYAxisTitle ()
void SetXAxisTitleColor (double r, double g, double b)
void GetXAxisTitleColor (double *r, double *g, double *b)
void SetYAxisTitleColor (double r, double g, double b)
void GetYAxisTitleColor (double *r, double *g, double *b)
void SetXAxisLabelColor (double r, double g, double b)
void GetXAxisLabelColor (double *r, double *g, double *b)
void SetYAxisLabelColor (double r, double g, double b)
void GetYAxisLabelColor (double *r, double *g, double *b)
void SetDrawLegend (bool flag)
bool GetDrawLegend ()
void OutputPostScriptPlot (string fileName)
void AddDataSet (CDataSet dataSet)
void AddDataSet (int numPoints, double *xValues, double *yValues)
Protected Member Functions
void PrecomputeDimensions ()
void ComputeLabelTickSpacing (double dataMin, double dataMax, double *plotMin, double *plotMax, double *tickSpacing, int numTicks, string axis)
double NiceNum (double x, int round)
void DrawFramePostScript ()
void DrawDataPostScript ()
void DrawMarker (string symbol, double size, bool filled, double xLocation, double yLocation, int dataSet)
void DrawXAxisTickMarksPostScript ()
void DrawYAxisTickMarksPostScript ()
void DrawXAxisGridLinesPostScript ()
void DrawYAxisGridLinesPostScript ()
void DrawXAxisLabelsPostScript ()
void DrawYAxisLabelsPostScript ()
void DrawXAxisTitlePostScript ()
void DrawYAxisTitlePostScript ()
void DrawLegendPostScript ()
Protected Attributes
double m_dXTotalSize
double m_dYTotalSize
double m_dXAxisSize
double m_dYAxisSize
double m_dDiagonalSize
double m_dBottomFrameSize
double m_dRightFrameSize
double m_dTopFrameSize
double m_dLeftFrameSize
int m_iXAxisNumberOfTicks
int m_iYAxisNumberOfTicks
double m_dXAxisNumbersSpacing
double m_dYAxisNumbersSpacing
char m_cXAxisLabelFormat [10]
char m_cYAxisLabelFormat [10]
vector< string > m_strXAxisLabels
vector< string > m_strYAxisLabels
string m_strXAxisTitle
string m_strYAxisTitle
int m_iXAxisNumberOfLabels
int m_iYAxisNumberOfLabels
double m_dXScale
double m_dYScale
double m_dMaxXExtent
double m_dMaxYExtent
double m_dMinXStartPoint
double m_dMinYStartPoint
double m_dMaxXEndPoint
double m_dMaxYEndPoint
double m_dFrameLineWidth
double m_dGridLineWidth
double m_dFrameColor [3]
double m_dGridColor [3]
double m_dXAxisTitleColor [3]
double m_dYAxisTitleColor [3]
double m_dXAxisLabelColor [3]
double m_dYAxisLabelColor [3]
double m_dLineDotSpacing
double m_dTickMarkLength
string m_strXAxisLabelFont
double m_dXAxisLabelFontSize
string m_strYAxisLabelFont
double m_dYAxisLabelFontSize
string m_strXAxisTitleFont
double m_dXAxisTitleFontSize
string m_strYAxisTitleFont
double m_dYAxisTitleFontSize
bool m_bDrawXAxisTickMarks
bool m_bDrawYAxisTickMarks
bool m_bDrawXAxisGridLines
bool m_bDrawYAxisGridLines
bool m_bDrawGridLinesDashed
bool m_bDrawLegend
ofstream outputFile
vector< CDataSet > m_dataSets
Detailed Description
The class responsible for storing and rendering all the data sets it contains. Although the currently implemented method for rendering of a plot is into a PostScript file, it is envisioned that other rendering methods, such as OpenGL can be implemented as well. The accessors are created for both setting and retrieving plot parameters.
Constructor & Destructor Documentation
CPlot2D::CPlot2D ()
The constructor for the class. Member variables are initialized to a set of values, which results in a, hopefully, pleasing plot without changing any of them.
CPlot2D::~CPlot2D ()
Nothing really to destruct…
Member Function Documentation
void CPlot2D::AddDataSet (CDataSet dataSet) [inline]
Adds a new dataset to the plot.
void CPlot2D::AddDataSet (int numPoints, double * xValues, double * yValues)
Adds a new dataset to the plot as two arrays comprised of the x and y values. The length of the array is supplied as well.
void CPlot2D::ComputeLabelTickSpacing (double dataMin, double dataMax, double * plotMin, double * plotMax, double * tickSpacing, int numTicks, string axis) [protected]
A function to compute label spacing, see the comments at the head of the implementation regarding the source of the algorithm.
void CPlot2D::DrawDataPostScript () [protected]
A function to draw the data sets in a PostScript format.
void CPlot2D::DrawFramePostScript () [protected]
A function to draw the frame surrounding the plot in a PostScript format.
void CPlot2D::DrawLegendPostScript () [protected]
A function to draw the legend in a PostScript format.
void CPlot2D::DrawMarker (string symbol, double size, bool filled, double xLocation, double yLocation, int dataSet) [protected]
A function to draw a single marker in a PostScript format.
void CPlot2D::DrawXAxisGridLinesPostScript () [protected]
A function to draw the x axis grid lines in a PostScript format.
void CPlot2D::DrawXAxisLabelsPostScript () [protected]
A function to draw the x axis labels in a PostScript format.
void CPlot2D::DrawXAxisTickMarksPostScript () [protected]
A function to draw the x axis tick marks in a PostScript format.
void CPlot2D::DrawXAxisTitlePostScript () [protected]
A function to draw the x axis title in a PostScript format.
void CPlot2D::DrawYAxisGridLinesPostScript () [protected]
A function to draw the y axis grid lines in a PostScript format.
void CPlot2D::DrawYAxisLabelsPostScript () [protected]
A function to draw the y axis labels in a PostScript format.
void CPlot2D::DrawYAxisTickMarksPostScript () [protected]
A function to draw the y axis tick marks in a PostScript format.
void CPlot2D::DrawYAxisTitlePostScript () [protected]
A function to draw the y axis title in a PostScript format.
double CPlot2D::GetBottomFrameSize () [inline]
Gets the bottom frame of the plot (e.g. the distance from the bottom of the image to the plot frame.
bool CPlot2D::GetDrawGridLinesDashed () [inline]
Gets the state of a flag that enables/disables the drawing of dashed grid lines.
bool CPlot2D::GetDrawLegend () [inline]
Get the state of a flag that enables/disables drawing the legend.
bool CPlot2D::GetDrawXAxisGridLines () [inline]
Gets the state of a flag that enables/disables the drawing of grid lines for the x axis.
bool CPlot2D::GetDrawXAxisTickMarks () [inline]
Gets the state of a flag which enables/disables drawing the x axis labels.
bool CPlot2D::GetDrawYAxisGridLines () [inline]
Gets the state of a flag that enables/disables the drawing of grid lines for the y axis.
bool CPlot2D::GetDrawYAxisTickMarks () [inline]
Gets the state of a flag which enables/disables drawing the y axis labels.
void CPlot2D::GetFrameColor (double * r, double * g, double * b) [inline]
Gets the color of the frame as an RGB triplet.
double CPlot2D::GetFrameLineWidth () [inline]
Gets the thickness of the line that the plot frame is drawn with.
void CPlot2D::GetGridColor (double * r, double * g, double * b) [inline]
Gets the color of the grid as an RGB triplet.
double CPlot2D::GetGridLineWidth () [inline]
Gets the thickness of the line that the grid is drawn with.
double CPlot2D::GetLeftFrameSize () [inline]
Gets the left frame of the plot (e.g. the distance from the left of the image to the plot frame.
double CPlot2D::GetRightFrameSize () [inline]
Gets the right frame of the plot (e.g. the distance from the right of the image to the plot frame.
double CPlot2D::GetTopFrameSize () [inline]
Gets the top frame of the plot (e.g. the distance from the top of the image to the plot frame.
void CPlot2D::GetXAxisLabelColor (double * r, double * g, double * b) [inline]
Gets the color, as an RGB triplet, for the x axis labels.
string CPlot2D::GetXAxisLabelFont () [inline]
Gets the font (as a string) that is used for the labels on the x axis.
double CPlot2D::GetXAxisLabelFontSize () [inline]
Gets the font size for the x axis labels.
int CPlot2D::GetXAxisNumberOfTicks () [inline]
Gets the number of tick marks and labels along the x axis.
double CPlot2D::GetXAxisNumbersSpacing () [inline]
Gets the spacing of tick marks and labels along the x axis.
double CPlot2D::GetXAxisSize () [inline]
Gets the x axis size of the plot.
string CPlot2D::GetXAxisTitle () [inline]
Gets the title for the x axis.
void CPlot2D::GetXAxisTitleColor (double * r, double * g, double * b) [inline]
Gets the color, as an RGB triplet, for the x axis title.
string CPlot2D::GetXAxisTitleFont () [inline]
Gets the font (as a string) that is used for the title on the legend for the x axis.
double CPlot2D::GetXAxisTitleFontSize () [inline]
Gets the font size that is used for the title on the legend for the x axis.
double CPlot2D::GetXTotalSize () [inline]
Gets the total size of the plot in the x dimension.
void CPlot2D::GetYAxisLabelColor (double * r, double * g, double * b) [inline]
Gets the color, as an RGB triplet, for the y axis labels.
string CPlot2D::GetYAxisLabelFont () [inline]
Gets the font (as a string) that is used for the labels on the y axis.
double CPlot2D::GetYAxisLabelFontSize () [inline]
Gets the font size for the y axis labels.
int CPlot2D::GetYAxisNumberOfTicks () [inline]
Gets the number of tick marks and labels along the y axis.
double CPlot2D::GetYAxisNumbersSpacing () [inline]
Gets the spacing of tick marks and labels along the y axis.
double CPlot2D::GetYAxisSize () [inline]
Gets the y axis size of the plot.
string CPlot2D::GetYAxisTitle () [inline]
Gets the title for the y axis.
void CPlot2D::GetYAxisTitleColor (double * r, double * g, double * b) [inline]
Gets the color, as an RGB triplet, for the y axis title.
string CPlot2D::GetYAxisTitleFont () [inline]
Gets the font (as a string) that is used for the title on the legend for the x axis.
double CPlot2D::GetYAxisTitleFontSize () [inline]
Gets the font size that is used for the title on the legend for the y axis.
double CPlot2D::GetYTotalSize () [inline]
Gets the total size of the plot in the y dimension.
double CPlot2D::NiceNum (double x, int round) [protected]
A function to aid the computation of label spacing, see the comments at the head of the implementation regarding the source of the algorithm.
void CPlot2D::OutputPostScriptPlot (string fileName)
The function, which is responsible for generating the PostScript output of the plot.
void CPlot2D::PrecomputeDimensions () [protected]
A function, which precomputes parameters of the plot, such as the overal size of the plot, the spacing of tick marks and labels, the length of the dashes in a dashed line.
void CPlot2D::SetBottomFrameSize (double value) [inline]
Sets the bottom frame of the plot (e.g. the distance from the bottom of the image to the plot frame.
void CPlot2D::SetDrawGridLinesDashed (bool flag) [inline]
Sets a flag that enables/disables the drawing of dashed grid lines.
void CPlot2D::SetDrawLegend (bool flag) [inline]
Set a flag to enable/disable drawing the legend.
void CPlot2D::SetDrawXAxisGridLines (bool flag) [inline]
Sets a flag that enables/disables the drawing of grid lines for the x axis.
void CPlot2D::SetDrawXAxisTickMarks (bool flag) [inline]
Sets a flag to enable/disable drawing the x axis labels.
void CPlot2D::SetDrawYAxisGridLines (bool flag) [inline]
Sets a flag that enables/disables the drawing of grid lines for the y axis.
void CPlot2D::SetDrawYAxisTickMarks (bool flag) [inline]
Sets a flag to enable/disable drawing the y axis labels.
void CPlot2D::SetFrameColor (double r, double g, double b) [inline]
Sets the color of the frame as an RGB triplet.
void CPlot2D::SetFrameLineWidth (double value) [inline]
Sets the thickness of the line that the plot frame is drawn with.
void CPlot2D::SetGridColor (double r, double g, double b) [inline]
Sets the color of the grid as an RGB triplet.
void CPlot2D::SetGridLineWidth (double value) [inline]
Sets the thickness of the line that the grid is drawn with.
void CPlot2D::SetLeftFrameSize (double value) [inline]
Sets the left frame of the plot (e.g. the distance from the left of the image to the plot frame.
void CPlot2D::SetRightFrameSize (double value) [inline]
Sets the right frame of the plot (e.g. the distance from the right of the image to the plot frame.
void CPlot2D::SetTopFrameSize (double value) [inline]
Sets the top frame of the plot (e.g. the distance from the top of the image to the plot frame.
void CPlot2D::SetXAxisLabelColor (double r, double g, double b) [inline]
Sets the color, as an RGB triplet, for the x axis labels.
void CPlot2D::SetXAxisLabelFont (string font) [inline]
Sets the font (as a string) that is used for the labels on the x axis.
void CPlot2D::SetXAxisLabelFontSize (double value) [inline]
Sets the font size for the x axis labels.
void CPlot2D::SetXAxisNumberOfTicks (int number) [inline]
Sets the number of tick marks and labels along the x axis.
void CPlot2D::SetXAxisNumbersSpacing (double spacing) [inline]
Sets the spacing of tick marks and labels along the x axis.
void CPlot2D::SetXAxisSize (double value) [inline]
Sets the x axis size of the plot.
void CPlot2D::SetXAxisTitle (string title) [inline]
Sets the title for the x axis. Usually this is where the units or quantity represented by the data should be displayed goes.
void CPlot2D::SetXAxisTitleColor (double r, double g, double b) [inline]
Sets the color, as an RGB triplet, for the x axis title.
void CPlot2D::SetXAxisTitleFont (string font) [inline]
Sets the font (as a string) that is used for the title on the legend for the x axis.
void CPlot2D::SetXAxisTitleFontSize (double value) [inline]
Sets the font size that is used for the title on the legend for the x axis.
void CPlot2D::SetXTotalSize (double value) [inline]
Sets the total size of the plot in the x dimension.
void CPlot2D::SetYAxisLabelColor (double r, double g, double b) [inline]
Sets the color, as an RGB triplet, for the y axis labels.
void CPlot2D::SetYAxisLabelFont (string font) [inline]
Sets the font (as a string) that is used for the labels on the y axis.
void CPlot2D::SetYAxisLabelFontSize (double value) [inline]
Set the font size for the y axis labels.
void CPlot2D::SetYAxisNumberOfTicks (int number) [inline]
Sets the number of tick marks and labels along the y axis.
void CPlot2D::SetYAxisNumbersSpacing (double spacing) [inline]
Sets the spacing of tick marks and labels along the y axis.
void CPlot2D::SetYAxisSize (double value) [inline]
Sets the y axis size of the plot.
void CPlot2D::SetYAxisTitle (string title) [inline]
Sets the title for the y axis. Usually this is where the units or quantity represented by the data should be displayed goes.
void CPlot2D::SetYAxisTitleColor (double r, double g, double b) [inline]
Sets the color, as an RGB triplet, for the y axis title.
void CPlot2D::SetYAxisTitleFont (string font) [inline]
Sets the font (as a string) that is used for the title on the legend for the y axis.
void CPlot2D::SetYAxisTitleFontSize (double value) [inline]
Sets the font size that is used for the title on the legend for the y axis.
void CPlot2D::SetYTotalSize (double value) [inline]
Sets the total size of the plot in the y dimension.
Member Data Documentation
bool CPlot2D::m_bDrawGridLinesDashed [protected]
Flag for enabling/disabling the drawing dashed grid lines.
bool CPlot2D::m_bDrawLegend [protected]
Flag for enabling/disabling the drawing of the legend.
bool CPlot2D::m_bDrawXAxisGridLines [protected]
Flag for enabling/disabling the drawing of x axis grid lines.
bool CPlot2D::m_bDrawXAxisTickMarks [protected]
Flag for enabling/disabling the drawing of x axis tick marks.
bool CPlot2D::m_bDrawYAxisGridLines [protected]
Flag for enabling/disabling the drawing of y axis grid lines.
bool CPlot2D::m_bDrawYAxisTickMarks [protected]
Flag for enabling/disabling the drawing of y axis tick marks.
char CPlot2D::m_cXAxisLabelFormat[10] [protected]
Format of labels along the x axis.
char CPlot2D::m_cYAxisLabelFormat[10] [protected]
Format of labels along the y axis.
vector<CDataSet> CPlot2D::m_dataSets [protected]
Storage for the datasets, implemented as a vector.
double CPlot2D::m_dBottomFrameSize [protected]
The size of the bottom frame.
double CPlot2D::m_dDiagonalSize [protected]
The size of the plot along its diagonal direction.
double CPlot2D::m_dFrameColor[3] [protected]
Frame color as an RGB triplet.
double CPlot2D::m_dFrameLineWidth [protected]
Width (thickness) of line used for the frame.
double CPlot2D::m_dGridColor[3] [protected]
Grid color as an RGB triplet.
double CPlot2D::m_dGridLineWidth [protected]
Width (thickness) of line used for the grid.
double CPlot2D::m_dLeftFrameSize [protected]
The size of the left frame.
double CPlot2D::m_dLineDotSpacing [protected]
Spacing of lines and dots for a dashed line.
double CPlot2D::m_dMaxXEndPoint [protected]
Maximum end point along x axis over all data sets.
double CPlot2D::m_dMaxXExtent [protected]
Maximum extent of x axis.
double CPlot2D::m_dMaxYEndPoint [protected]
Maximum end point along y axis over all data sets.
double CPlot2D::m_dMaxYExtent [protected]
Maximum extent of y axis.
double CPlot2D::m_dMinXStartPoint [protected]
Minimum starting point along x axis over all data sets.
double CPlot2D::m_dMinYStartPoint [protected]
Minimum starting point along y axis over all data sets.
double CPlot2D::m_dRightFrameSize [protected]
The size of the right frame.
double CPlot2D::m_dTickMarkLength [protected]
Length of tick marks.
double CPlot2D::m_dTopFrameSize [protected]
The size of the top frame.
double CPlot2D::m_dXAxisLabelColor[3] [protected]
X axis label color as an RGB triplet.
double CPlot2D::m_dXAxisLabelFontSize [protected]
Font size for x axis label.
double CPlot2D::m_dXAxisNumbersSpacing [protected]
Spacing between tick marks along the x axis.
double CPlot2D::m_dXAxisSize [protected]
The size of the plot in the x direction. Not including the frames around it.
double CPlot2D::m_dXAxisTitleColor[3] [protected]
X axis title color as an RGB triplet.
double CPlot2D::m_dXAxisTitleFontSize [protected]
Font size for x axis title.
double CPlot2D::m_dXScale [protected]
Scale along x axis that converts dataset values to the plot space.
double CPlot2D::m_dXTotalSize [protected]
Total size of the plot in the x direction. Including the frames around it.
double CPlot2D::m_dYAxisLabelColor[3] [protected]
Y axis label color as an RGB triplet.
double CPlot2D::m_dYAxisLabelFontSize [protected]
Font size for y axis label.
double CPlot2D::m_dYAxisNumbersSpacing [protected]
Spacing between tick marks along the y axis.
double CPlot2D::m_dYAxisSize [protected]
The size of the plot in the y direction. Not including the frames around it.
double CPlot2D::m_dYAxisTitleColor[3] [protected]
Y axis title color as an RGB triplet.
double CPlot2D::m_dYAxisTitleFontSize [protected]
Font size for y axis title.
double CPlot2D::m_dYScale [protected]
Scale along y axis that converts dataset values to the plot spac.
double CPlot2D::m_dYTotalSize [protected]
Total size of the plot in the y direction. Including the frames around it.
int CPlot2D::m_iXAxisNumberOfLabels [protected]
Number of labels along the x axis.
int CPlot2D::m_iXAxisNumberOfTicks [protected]
Number of tick marks along the x axis.
int CPlot2D::m_iYAxisNumberOfLabels [protected]
Number of labels along the y axis.
int CPlot2D::m_iYAxisNumberOfTicks [protected]
Number of tick marks along the y axis.
string CPlot2D::m_strXAxisLabelFont [protected]
Font for x axis labels.
vector<string> CPlot2D::m_strXAxisLabels [protected]
Labels along the x axis.
string CPlot2D::m_strXAxisTitle [protected]
Title of x axis.
string CPlot2D::m_strXAxisTitleFont [protected]
Font for x axis title.
string CPlot2D::m_strYAxisLabelFont [protected]
Font for yx axis label.
vector<string> CPlot2D::m_strYAxisLabels [protected]
Labels along the y axis.
string CPlot2D::m_strYAxisTitle [protected]
Title of y axis.
string CPlot2D::m_strYAxisTitleFont [protected]
Font for y axis title.
ofstream CPlot2D::outputFile [protected]
The output stream.