
THERMAL IMAGING SCANNING CAMERA
The human visual system is sensitive to wavelengths of light from about 400 nanometers (interpreted a violet) to about 700 nanometers (perceived as red). This range of wavelengths is commonly referred to as the visible light and serves as the foundation of the visual spectrum. Although giving rise to a bewildering variety of colours, this range of wavelengths is only a fraction of all detectable wavelengths. From short wavelength gamma-rays to kilometre long radio waves we are potentially exposed to this electromagnetic spectrum on a daily basis. Of particular interest to us are the waves in the infra-red range, from about 2 micro-meters to 22 micro meters. These waves carry radiant heat.
The detection of infra-red waves in the range from 2 to 22 micrometers can be accomplished in a variety of ways; via pyro-electric sensors used in motion detectors to thermopiles, which are more sophisticated in that they can measure static heat sources [1]. Just like a digital photo camera ‘sees’ and records colour, there are commercial cameras that detect radiant heat and form an image [2]. The only minor problem is that the cost of these thermal imaging cameras is still prohibitively expensive for most of us. However, there are alternatives for the technologically inclined; thermopile sensors are available at a reasonable cost (e.g. around $50-100) that can read one or more (as high as eight) values of radiant heat. As of writing this, Devantech has the TPA81 sensor array available and others have successfully used MELEXIS products.
What I am presenting on this page is by no means the first implementation of a thermal imaging camera using the TPA81 thermopile sensor. There are a few interesting implementation such as [3,4], which have served as the basis of my contraption. However, I have not seen one with a pan/tilt combination using this sensor with the hardware available for 3D printing and discussing on how to perhaps improve the resulting image.
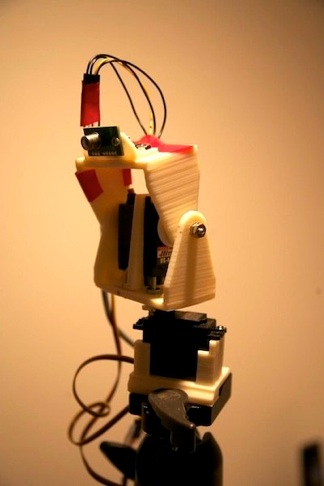
The thermal imaging scanning camera was built using a TPA81 thermopile sensor array mounted atop a servo-controlled pan/tilt head attachable to a tripod. The sensor feeds information to an Arduino Uno microcontroller [5], which, in turn communicates the thermal readings to a computer via a serial connection. The figure below shows the general setup mounted on a tripod.
The ensuing discussion will be divided into four parts; the physical hardware, electronics, firmware and post-capture processing software.
Physical Hardware
The pan/tilt mechanism formed by the two servo motors and held together by brackets is quite simple. The lower servo, attached to the tripod via a tripod attachment, supplies the rotational motion to sweep (or pan) across the field of view in the horizontal plane. The upper servo, mounted to the lower bracket via a servo bracket, is attached to one arm of the upper bracket providing the tilt. Two #6 machine screws form the pivot connection between the two brackets.
The TPA81 was mounted on the top bracket via a small adapter. The various connections holding the brackets together were accomplished using the small screws supplied with the servos.
The realization of the physical hardware can be accomplished in a variety of ways; pre-formed metal brackets are available at various robot supply stores, the brackets can be made at home by bending thin metal plates, or, to go with the emerging ‘fabrication at home’ trend, printed on a 3D printer. This project uses hardware elements designed on a computer to fit HITEC HS-422 servos and printed on a Thing-o-matic 3D printer using ABS plastic filament providing custom elements that are strong yet relatively inexpensive. The whole physical hardware design is available, of course free of charge, for download and printing on your 3D printer if you so desire. Just browse over to thing #22527 on Thingiverse to get the parts.
The assembly of the hardware should be straight forward. Generally there are no pre-formed mounting holes, so there is a built-in adjustably to suit your needs if you use a different servo or attachment method. Of course, there are various size restrictions since the design used a HS-422 servo.
Electronics
The electronics is quite simple, requiring just a minimum amount of soldering and a few components. Similar projects [3,4] did an excellent job in outlining the micro-controller and communications, so here only the salient features of the electronics will be discussed drawing attention to the particularities of this design. The figure below shows the general schematics of the micro-controller, servos and the TPA81 sensor.
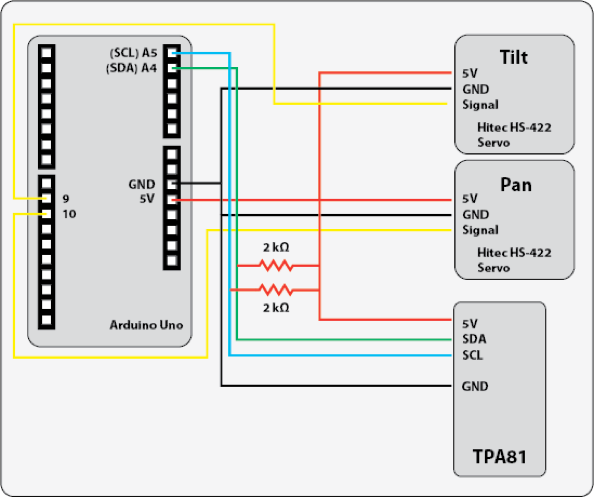
The TPA81 thermopile sensor communicates with the Arduino micro-controller via an I2C bus. Although the manufacturer recommends two pull-up resistors in the neighbourhood of 1.8 kOhm to be put on the SDA and SCL lines, other implementers [3,4] make no mention of using them. I have tried without the resistors and no luck. As soon as two 2 kOhm resistors from my spare box were added to the lines, the communication was flawless. The connection to the servos is a standard 5V, ground and signal. My version was put together on a perfboard with pins soldered on so the whole circuit attaches on top of the Arduino like other “shields”.
Firmware
The firmware running on the Arduino could not be simpler. After the usual setup of input/output pins and assignment of control parameters, the micro-controller enters an endless cycle, which contains two nested loops. These two inner loops carry out the positioning of the pan/tilt mechanism, communication with the TPA81 sensor and feeding the temperature readout to the attached computer. The code below borrows from the great work of [3,4] with a few minor modifications, as will be discussed later.
#include <Wire.h>
#define TPA81ADDR (0xd0>>1)
#include <Servo.h>

Servo panServo;
Servo tiltServo;

int tilt=0;
int pan=0;
int tiltSteps=65;
int panSteps=65;
int tiltIncrement=2;
int panIncrement=2;

void setup()
{

  tiltServo.attach(9);
  panServo.attach(10);
  tiltServo.write(0);
  panServo.write(0);

  Wire.begin();
  Serial.begin(9600);
}

void loop()
{
  byte b;
  int i;

  Serial.print("begin thermal scan");
  Serial.println("");
  Serial.print(tiltSteps,DEC);
  Serial.print(" ");
  Serial.print(panSteps,DEC);
  Serial.println("");

  for (pan=0;pan<panIncrement*panSteps;pan+=panIncrement)  {
    panServo.write(pan);
    delay(150);

    for (tilt=0;tilt<tiltIncrement*tiltSteps;tilt+=tiltIncrement) {
      tiltServo.write(tilt);
      delay(150);
      Wire.beginTransmission(TPA81ADDR);
      Wire.write(4);
      Wire.endTransmission();
      Wire.requestFrom(TPA81ADDR,(int)1);

      while (Wire.available()<1) {
       ;
      }

      b=Wire.read(); // receive a byte as character

      Serial.print(b,DEC);
      Serial.print(" ");
    }
    Serial.println("");
  }

  Serial.print("end thermal scan");
  Serial.println("");

  panServo.write(0);
  tiltServo.write(0);
}
The variables tiltSteps and panSteps define the number of increments (tiltIncrement and panIncrement) the servos will cover, such that the total angular extent of the ‘image’ formed will be (tiltSteps * tiltIncrement) by (panSteps * panIncrement). It would be relatively easy to add an offset to the starting and ending angles of pan and tilt so that scanning commences not at zero but at an offset, as we will see later. The TPA81 has eight pixels, but the above code reads only one of them (number 4) and sends the reading to the attached computer via a serial link. The mechanism pauses for 150 milliseconds after a new pan/tilt position is set. Why 150 milliseconds? One reason is that the mechanism has to stabilize itself after a movement; to reduce vibrations due to inertia. The other reason is to allow the TPA81 sensor to take a new reading and make it available for the micro-controller. The implication of changing this number will be discussed later.
If the above firmware is uploaded to the Arduino and a scan is performed, something like the following image is obtained.
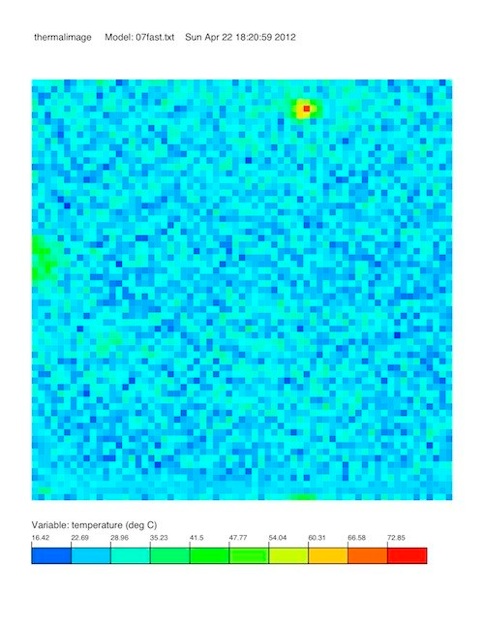
A couple of things are obvious from the image; one, that it is not that pretty, the other is that there is a considerable amount of fluctuation on the lower end of the temperature scale, in other words, lot of noise. What was this image supposed to represent? Well, on the left, about mid-height was my head, shown as a greenish blob reading about, you guessed it, 36+ degrees Celsius. A bit lower, to the right was my forearm. In the upper section, the red dot is a pot light in the ceiling, fairly hot in comparison to its surroundings. The ambient temperature was about 17-18 degrees Celsius.
Another ‘limitation’ present in the sensor is that it reads the temperature in an area subtended by about an angle of 6 degrees in both the horizontal and vertical. What this means is that it reads an ‘average’ temperature of an area within that window of 6 degrees. Of course, the farther the heat ‘source’, the 6 degree angle covers a larger area! Thus, to read/sample the surrounding area’s temperature, the sensor should be repositioned by 6 degrees in both the pan and tilt direction to read a completely new reading. However, this translates to only a 15 by 15 pixel image for an area covering 90 by 90 degrees. Not that impressive. To increase the ‘resolution’, the repositioning of the sensor’s direction could be made less than the 6 degree field of view. However, in this case, the reading covers or averages out the newly sampled area with part of the one sampled in the previous increment. Thus, although images of larger size (e.g. more points sampled) can be made, in fact, the resulting image would not be comparable to an image obtained from a sensor with a smaller field of view. One has to keep this in mind! Thus, to increase the resolution, just sample the space in increments less than the 6 degrees field of view. The above code increments pan/tilt by 2 degrees and the preceding image was created using such technique.
The other issue of ‘noise’ in the image can be improved at two places; in the firmware and in post-processing on the computer. The idea is that if one could take multiple samples at the same pan/tilt location and average their values perhaps a better estimate of the actual temperature could be obtained, thus reducing noise. The most obvious choice would be to make use of all eight pixels on the sensor and store all readings. In essence, this would lead to eight images taken ‘panIncrement’ apart. These eight images then could be averaged to improve the quality of the final image. I have explored this option but was not satisfied with the results. Why? Even though there is a noticeable improvement in reducing noise, since the average image size rarely exceeds 100 pixels, there is a visible vertical band of up to seven pixels that are a result of averaging one, two, three and up to seven samples before all eight values are available, deteriorating the quality of the whole image. The other alternative, although costly time-wise, is to obtain multiple readings at the same location separated by a time interval. The following four images were taken such a way. Four readings were taken at 50, 75, 100 and 300 milliseconds apart as shown in the figures below, where the top row corresponds to 50 and 75, while the bottom row to 100 and 300 millisecond intervals between readings, respectively.
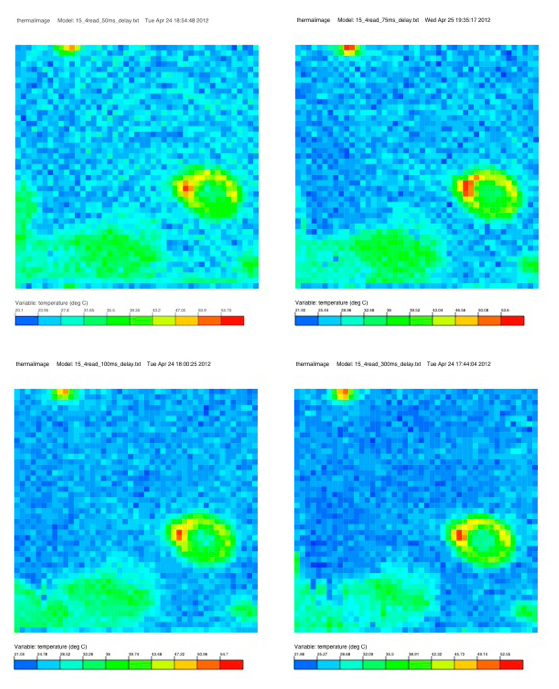
Looking at the upper left (50ms) image, the noise at lower temperatures still manifested itself, however, it was considerably less than before. As the time interval between each of the four readings increases, the noise (in the blueish-cyanish colours) was reduced giving a more uniform colour image. Perhaps the 300ms image looks the best. However, this improvement in quality comes at a cost; the scan time for the whole image has substantially increased since we are waiting six times more in comparison to the 50ms case. Thus, as a trade-off, the 100 millisecond pause was considered reasonable and has been used ever since. Finally, the modified code is shown below incorporating the multiple sampling.
#include <Wire.h>

#define TPA81ADDR (0xd0>>1)

#include <Servo.h>
Servo panServo;
Servo tiltServo;
int tilt=0;

int pan=0;

//int tiltSteps=24;
//int panSteps=24;
//int tiltIncrement=5;
//int panIncrement=5;
int tiltSteps=45;
int panSteps=45;
int tiltIncrement=2;
int panIncrement=2;
int tiltStartAngle=30;
int panStartAngle=0;

void setup()
{
  tiltServo.attach(10);
  panServo.attach(9);
  tiltServo.write(0);
  panServo.write(0);

  Wire.begin();
  Serial.begin(9600);
}

void loop()
{
  byte b;
  int i;
  Serial.print("begin thermal scan");
  Serial.println("");
  Serial.print(tiltSteps,DEC);
  Serial.print(" ");
  Serial.print(panSteps,DEC);
  Serial.println("");

  for (pan=panStartAngle;pan<(panIncrement*panSteps+panStartAngle);pan+=panIncrement)  {
    panServo.write(pan);
    delay(150);
    for (tilt=tiltStartAngle;tilt<(tiltIncrement*tiltSteps+tiltStartAngle);tilt+=tiltIncrement) {
      tiltServo.write(tilt);
      //delay(300);
      //delay(1000);
      for (i=1;i<=4; i++) {
        delay(100);
        Wire.beginTransmission(TPA81ADDR);
        Wire.write(4);
        Wire.endTransmission();
        Wire.requestFrom(TPA81ADDR,(int)1);
        while (Wire.available()<1) {
          ;
        }

        b=Wire.read(); // receive a byte as character

        Serial.print(b,DEC);
        Serial.print(" ");
      }
      Serial.println("");
    }
  }

  Serial.print("end thermal scan");
  Serial.println("");
  panServo.write(0);
  tiltServo.write(0);
}
Post-Capture Processing
The readings from the sensor, through the Arduino micro-controller, are transmitted to the computer as a set of four number per pan/tilt sampling location. Their numbers are logged in the serial output window of the Arduino development environment and save into a text file. This text file serves as the input to a C++ command line program that reads the values and stores them in a vector. Once all values are read, the average per sampling location is computed and a PostScript file is written out with the thermal image and a legend, as seen in the preceding images.
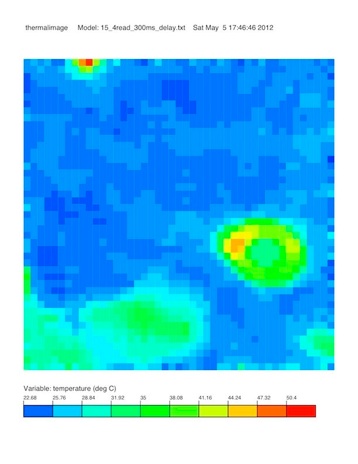
As hinted at earlier, another way to improve image quality is to pass the image through a filter to smooth out the noise. There are many potentially useful filters available, but as of this writing, only a median filter was implemented. Description of the median filter can be found in [6] with implementation details at [7]. To see the effect of the median filter, compare the two images below; the averaged, but the unfiltered image is on the left and the averaged and the median filtered image is on the right.
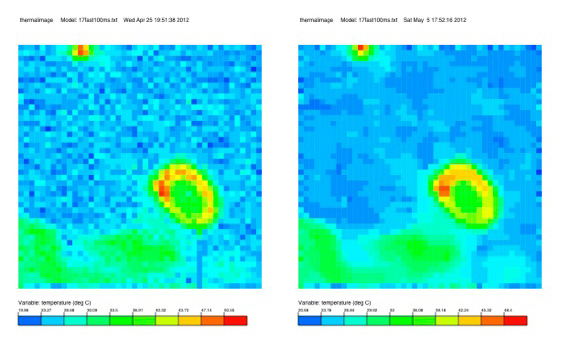
The improvement in image quality with respect to noise is noticeable. The areas of higher temperature were delineated from the ambient, bringing out the donut-shaped ring light on the right, to the left of it the laptop used in capturing the image. Left of the laptop is my arm and even farther left is my shoulder. The red dot on the top is the pot light, as before. The warmer area in the lower right puzzled me for a while until I realized that it was the laptop’s power supply. Mystery solved!
I hope that this little article will help you to make your own thermal imaging scanner or clarified a few issues with the building and running such home-brewed contraption. Of course, like everything else you read on the Internet, there might be errors in the text both writing and technical. If you find one, please contact me so I can update this page…
References
- 1.TPA81 Thermopile Array Technical Specification (http://www.robot-electronics.co.uk/htm/tpa81tech.htm)
- 2.FLIR (http://www.flir.com/ca)
- 3.DIY Thermal Imaging System for under $200 (http://spill.tanagram.com/2010/11/24/diy-thermal-imaging-system-for-under-200)
- 4.Thermoscanner (http://www.designer2k2.at/index.php?option=com_content&view=article&id=30:thermoscanner&catid=13:arduino&Itemid=40)
- 5.Arduino Uno Microcontroller (http://arduino.cc/en/Main/ArduinoBoardUno)
- 6.Median filter on Wikipedia (http://en.wikipedia.org/wiki/Median_filter)
- 7.Median filter (http://www.librow.com/articles/article-1)